Trading with the Cloud – Ichimoku Kinko Hyo Explained
Trading with the Cloud – Ichimoku Kinko Hyo Explained
>>>Before Proceeding With Ichimoku Kinko Hyo, Get The Free Candlesticks Manual
Trading with Ichimoku Kinko Hyo- Technical analysis is the art of reading charts to form an idea about future price levels. It all started in the United States, where technical traders charted the commodities and the stock markets.
Back in those days, no Personal Computers (PC) existed, making charting difficult and time-consuming. Today’s traders take for granted the simple way a computer allows analyzing hundreds of years of technical data.
Yet, one of the most influential technical analysis patterns appeared during those years. Middle of 1950’s was the era when patterns like the head and shoulders, wedges, double and triple bottoms, etc. were documented.
Later, indicators and oscillators moved technical analysis to a new level. And then, something happened.
The Western world came to learn about the way the Japanese used to forecast rice futures. Since early 1700’s, the Japanese used candlesticks to chart the rice market.
A candlestick has a real body (the distance between the opening and closing prices) and two shadows (upper and lower shadow) that mark the high and the low in the candle. The Western world embraced the Japanese candlesticks chart wholeheartedly as they became the number one choice among retail traders and trading professionals.
Because of their powerful reversal patterns and fabulous risk-reward ratios, the Japanese candlesticks patterns are widely used to this day. Anyone that came across a chart, at any one point in his/her trading career, must have heard of bullish and bearish engulfing, the hammer, the stars, the Doji candle, and so on.
But together with the Japanese candlesticks, technical analysts in the Western world gained access to one of the most powerful and mysterious indicators of them all- the Ichimoku Kinko Hyo.
Explaining the Ichimoku Kinko Hyo Elements
The Ichimoku Indicator is the work of Goichi Hosoda. In the middle of 1950’s, he used the pseudonym Ichimoku Sanjin, hence the name we know today.
Later, Hidenobu Sasaki revived his work, making the Ichimoku Kinko Hyo indicator famous in the entire technical analysis world.
The Ichimoku indicator is available to use on any trading platform. Starting with the famous MT4 and MT5 platforms, and ending with more sophisticated ones, the Ichimoku is omnipresent.
Depending on the platform, it appears either as a trend indicator or an oscillator. The truth is that it has a bit of everything.
To understand the Ichimoku indicator, one must understand its elements. Together, they create a system that shows the market’s equilibrium.
In fact, a rough translation from Japanese for the Ichimoku Kinko Hyo means “equilibrium at a glance.”
In other words, all elements show a state of equilibrium. However, it doesn’t mean that the market will range, but only when aligned, they represent a powerful indication of where the market goes next.
The elements of the Ichimoku indicator are:
- Senkou A
- Senkou B
- Kinjun
- Tenkan
- Chinkou
But where is the cloud?
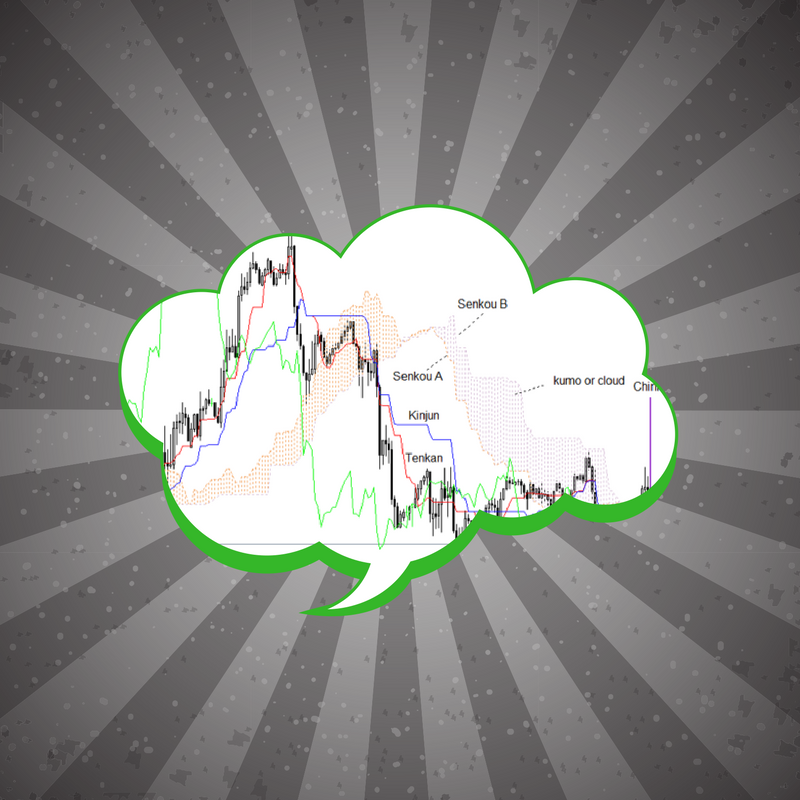
The Kumo, or the cloud, is defined by the two Senkou lines, A and B.
The Ichimoku Cloud
We won’t go into details here explaining the mathematical formulas behind the five elements that make the Ichimoku Kinko Hyo system as it is quite a complicated description. The aim is to learn how to use them, not to know how to calculate them. Nowadays, PC’s do that with a simple mouse click.
However, it is worth mentioning that all five elements are averages, and the Kinjun and Tenkan lines consider series of higher highs and lower lows for plotting their values.
In comparison with the classic MA’s (Moving Averages) that existed in the Western approach to technical analysis, this represented quite a difference.
Coming back to the cloud, the Senkou A and B lines represent its ages. The beauty of it is that the Ichimoku Kinko Hyo projects the cloud 26 periods forward in time.
Check the recent EURUSD hourly chart. The cloud is the distance between the Senkou A and Senkou B lines. Moreover, the indicator projects the cloud (or the two Senkou lines) twenty-six periods further in time.
When learning to use the Ichimoku Kinko Hyo, you must start from the current prices. Why?
It is the only way to see the projection of the cloud. Later, if you want to back-test a system, to check a trading strategy’s results, only go and check historical prices, but consider that for every actual candlestick, the cloud’s values were already plotted twenty-six periods ahead.
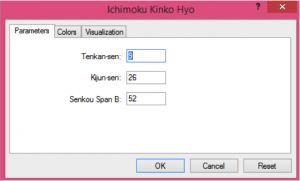
Goichi Hosoda used the 9, 26, and 52 settings as default ones for the Nikkei Index. In the Forex market or with other financial instruments, some values may work better, but traders around the world still argue the original system works best.
Because of that, the MT4, the most famous trading platform for retail trading, offers the Ichimoku Kinko Hyo with the same values. Naturally, one can change them quickly.
The Kinjun and Tenkan Lines
The Kinjun and Tenkan lines (the blue and red ones on the earlier chart) average the sum between the highest highs and lower lows of the default period.
In strong trending markets, the Tenkan is always above (in a bullish trend) or below (in a bearish trend) than Kinjun.
Traders also use them as dynamic support and resistance levels. Naturally, the Kinjun offers stronger support or resistance due to the fact that it incorporates more periods in its calculation.
Important: the Ichimoku Kinko Hyo projects the two lines at the current prices. Hence, they’ll offer support or resistance for the current price.
The Chinkou Line
The Chinkou is nothing but a Displaced Moving Average (DMA). The green line on the chart 
For many traders, it is a mystery line. Some traders simply delete it from the chart because they find it useless.
However, the Ichimoku Kinko Hyo system would be incomplete without it. Perhaps the most critical element of it, the Chinkou has a mysterious aura that few understand.
Let’s remember what the Ichimoku Kinko Hyo system means: a state of equilibrium. The equilibrium refers to the current price.
The current market price finds itself in a state of equilibrium, as the indicator projects both future and past levels of the same period: twenty-six. Imagine the cloud and the Chinkou line, with the price in the middle of them: the state of equilibrium that incorporates past, present and future prices.
How to Trade with the Ichimoku Kinko Hyo
The state of equilibrium appears evident if one refers to the current market price. How about when checking historical prices?
The secret is to:
- Use the Crosshair tool on the MT4 platform
- Plot it on one candle
- Drag it twenty-six periods before and after the desired candle, to find the state of equilibrium
In strong, bullish trending markets, the state of equilibrium has:
- A rising Kumo
- The Tenkan above the Kinjun lines and both rise
- The Chinkou keeps a decent distance from the candles in front of it
The recent EURCAD rise showed the perfect conditions for the Ichimoku Kinko Hyo trending system. That’s what traders strive to find: the earliest sign to ride the perfect trend with the Ichimoku indicator!
In strong, bearish trending markets, the state of equilibrium has:
- A falling Kumo
- The Tenkan below the Kinjun lines and both rise
- The Chinkou keeps a decent distance from the candles in front of it
The EURGBP recent price action was no fun for the bulls. The pair collapsed from above 0.8900, in a bearish spiral, forming the perfect bearish conditions for the cross.
What’s the common thing between the two charts? You guessed it, the one element most traders ignore: the Chinkou line.
In both trends, bullish or bearish, the Chinkou keeps a distance before the actual prices. As long as this distance holds, the trend will never turn, no matter how many reversal patterns the actual price may form.
The ability of Chinkou to get closer to the actual price signals the trend loses strength. Traders are warned to trail stops or book profits, as a consolidation period, or even a reversal is in the cards.
Two Ways to Use the Ichimoku Cloud
As many traders choose to focus on the cloud, let’s have a look at a couple of ways to use it in Forex trading. One way and the obvious one is to check when the Senkou A and Senkou B lines cross each other.
That’s when the cloud changes its stance, from bullish to bearish, or from bearish to bullish. The cross represents a powerful signal, and many traders use it as a sign that the trend reverses.
The same EURGBP chart shows trends starting/ending when the cloud changes its colour. However, keep in mind here that when checking historical prices, the moment the cloud “turns” corresponds to a price level twenty-six periods ahead.
Another way to use the cloud is to trade support and resistance levels provided by it. Knowing the clouds values projected further in time, traders wait for the actual price to reach the cloud before going long or short.
As defined earlier, in strong trends, the price never reaches the cloud. When the price touches the cloud, it shows a weakening trend.
The way to trade this strategy is to wait for a trend to start and let it run for a while. When the market enters the state of equilibrium, and on the first cloud test, traders go short or long depending on the trend’s nature. And that’s it, only once, as more retests show a weakening trend.
A bearish trend on the AUDNZD pair shows the state of equilibrium with the Ichimoku Kinko Hyo forming. The cloud acts as a resistance when the price first hits it.
In some cases, even the second and the third tests are good enough for a trade. However, that happens only in strong trends, while the first test often works, especially if traders use a proper risk-reward ratio.
RR Ratios When Trading Support and Resistance with the Ichimoku Cloud
No trade makes sense without a well-defined money management system. And, no money management system allows for a reward smaller than the risk involved.
Proper ratios have two or three times the reward when compared with the risk. Traders should align with this rule meticulously for every trade ever taken in the Forex market.
No one says bigger ratios won’t work. In fact, in my professional trading course, I am showing how I have reached to even 1:30 risk:reward ratios.
The setups for trading the Ichimoku cloud are:
- Go long/short when the price touches the cloud for the first time, providing trending conditions exist for a while
- Place a stop loss at the top/bottom of the cloud
- Set the risk:reward as to respect the 1:2 or 1:3 ratio
Trade Example: Using the rules from above, here’s the implementation of the same AUDNZD short trade. The stop-loss order defines the risk, and the projected risk defined the target. While it took a while, the trade worked like a charm.
Now you see why using such risk-reward ratios is key to successful trading: they leave room for error! There is no perfect setup that works one hundred percent of the time! But the higher the risk-to-reward ratio, the better it is, as it makes room for losing trades.
Sometimes, the distance needed for the stop loss is quite significant. That’s especially true when traders apply the Ichimoku Kinko Hyo indicator on bigger timeframes.
However, it doesn’t mean it is impossible to trade this setup. Great traders usually do the following:
- Risk only one percent of the trading account on any given trade
- Transform the number of pips needed for the stop loss in the currency of your trading account by adjusting the volume
- Take the trade!
Trading the Kinjun/Tenkan Cross
Another way to trade with only some elements of the Ichimoku Kinko Hyo system is to wait for the Kinjun and Tenkan lines to cross. Such crosses are the earliest sign that a trend might reverse.
However, they are prone to failure many times. They act just like two moving averages crosses above and below one another, showing bullish or bearish conditions.
The key here is to trade the Kinjun/Tenkan cross in such a way as to avoid fake signals. To do that, traders use it not as a reversal signal, but as a continuation one.
Even the strongest trends take a breather and pause for a while. This may be due to upcoming economic news or to some other significant event, or just the supply and demand reach equilibrium.
Therefore, the idea is to spot a strong trend, like the one on the AUDUSD pair above, and wait for the first bearish Kinjun/Tenkan cross. Because strong trends resume after the first consolidation, the chances are that the new bullish cross will signal the same.
As for the money management system, it should be evident by now: stop loss at the bottom of the cloud, with the take profit level projected in such a way to respect the 1:2 and 1:3 rr ratio, while keeping everything under the one percent rule.
If you think of the multitude of currency pairs and timeframes, conditions like the one above aren’t difficult to find. The important thing is to avoid correlated pairs and timeframes, thus reducing overtrading.
Conclusion
The Ichimoku Kinko Hyo is an “all-in-one” system with an active trending component. I mentioned earlier that it is an oscillator too, and that comes from the fact that it averages higher highs and lower lows, just like traders using divergences do.
Its most significant advantage is that it is visible so that it is easy for traders to spot new trends forming in front of their eyes. A bullish cloud is a bullish cloud, and if one wants to go short, the reason doesn’t belong to the Ichimoku Kinko Hyo system.
Like any trading system, success in trading with the Ichimoku cloud has much to do with money management and the way a trade is executed.
Do not forget that psychology and raw emotions play an essential role. But if there’s a plan to short or long a currency pair using specific rules, then traders avoid the emotional roller-coaster.
When you know that there are bigger chances for a trade to be a winner when the price first reaches the cloud, or when the Kinjun/Tenkan cross shows continuation, trading becomes fun and exciting.
To sum up, all elements of the Ichimoku Kinko Hyo indicator/system have a defined role in the past, present, and future prices. After all, this is everything a trader needs, only that it comes via one single indicator: projecting next levels based on historical prices!
Together with the Japanese candlesticks techniques, the Ichimoku indicator offers extraordinary risk-reward ratios for the disciplined trader. The only variable remains the trader’s attitude and the ability to respect a trading setup.
Happy Trading,
Colibri Trader
p.s.
If you want to learn from my professional trading system, you can click HERE







Thanks for your article. Could you give us the better values than you talk to set ichimoku unstead default values…
Sorry english is not my native language. I understand reading…
Hi Olivier,
It all depends on the trader’s preferences. For one trader they might be “X”, for another they might be “Y”.
I do not personally use Ichimoku in my trading strategy- I have only written about it because of a popular demand. If you want to check out my trading strategy I do use pure price action since I have found this to be the most effective approach when trading the markets. Let me know if you have any questions.
Tank you for your answer. I was curious about the change of ichimoku values setting you xérès talking because i am wondering if i change the values of my ichimoku setting, i will be out of what all the mass is watching, i will be the only one to work on this new ichimoku on the graphique. With this set i could be un contrary of the mass or just draw support and résistance that only me see ? That will be effective or i am wrong. Sorry for english. Not native language
No problem Olivier- you will need to test and see what the results are. If your results are positive, then you should stick to your trading plan and strategy. Nobody will be able to tell you if it will work unless you try it yourself and see if that works for you. Just use a Demo account if you are not sure what you are doing please! Do not risk real money for testing purposes 🙂
I was writted : That will be not effective….
🙂 I got it