Price Action Gaps- 2 Different Ways to Trade Gaps Successfully
Price Action Gaps- 2 Different Ways to Trade Gaps Successfully
Price action gaps have a long history in technical analysis. Since traders started to interpret patterns and analyse charts, gaps turned out to have a special place in their hearts.
Depending on the approach, there are many ways to trade gaps. The most popular one is the Western approach to price action gaps. However, even in this case, the interpretation of a gap differs as traders fail to understand the uniqueness of the currency market.
Since the foreign exchange market is open five days a week, gaps are less frequent than on other markets. However, to trade gaps successfully according to the Western approach, one needs to use a strategy coming from the stock market.
Bonus Material: Get the Free E-book on Candlesticks
As stocks do close at the end of the day, gaps are imminent at the opening next day. Yes, futures exist, but the stock market gaps every day.

Effectively, it means it is liquid enough to take any amount at any time during the opening hours. And then there’s the weekend.
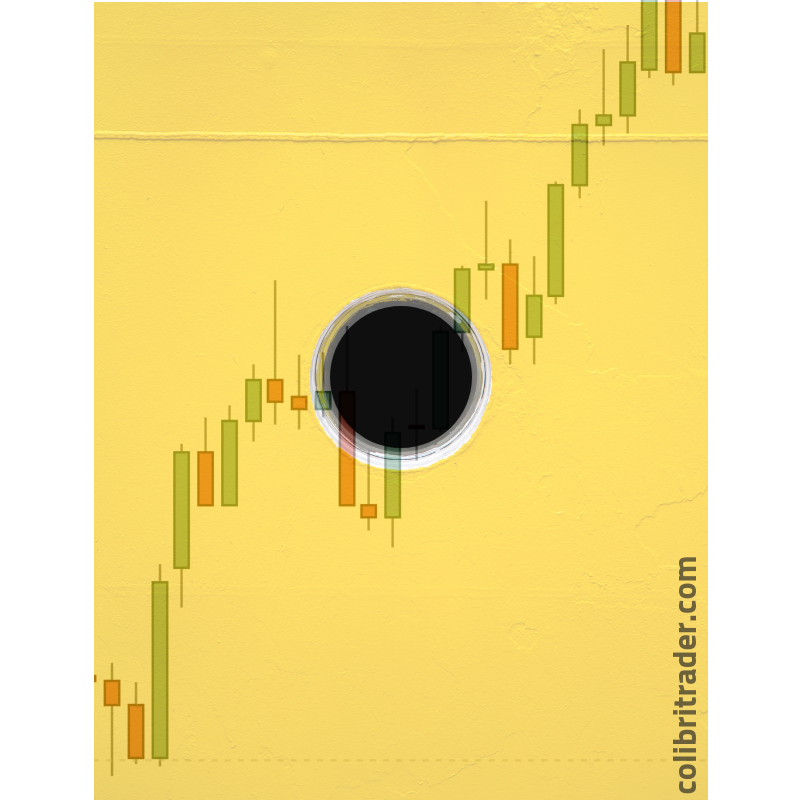
Price action gaps are known to form over the weekend on the currency market. This particularity has tremendous implications, but the interpretation is, again, unique.
As always when it comes to technical analysis, the Japanese look at gaps differently. The exciting thing is that gaps in Japanese technical analysis have an interpretation of over two centuries old.
In this article, I’ll use both approaches, the Western and the Japanese one, to make the most of trading with price action gaps.
I’ll look at the reality of today’s currency market and apply both principles, letting the readers to decide what works best when interpreting gaps in their Forex trading.
Price Action Gaps Defined
Before discussing how to trade price action gaps, we need to understand what they really are. Even a simple thing like this raises controversies.
In fact, over the weekend a lot of things happen.
Think of political events like elections, G7 meetings, natural catastrophes…
Chinese data typically comes out on Sundays (the Australian Dollar experiences high volatility when Chinese data comes out).
All of these among many others (interviews, speeches, etc.), can move the market at the opening.
Despite large financial institutions having branches in all financial centres, liquidity is very thin when the New Zealand and Australian trading centres open.
As such, the market opens with a gap when the fundamentals hit the wires.
Price action gaps differ from broker to broker too. And some gaps don’t matter at all.
One question arises, though: how to filter which gap is meaningful and which one isn’t?
What Makes a Gap
A gap is a difference between the Friday’s closing prices and the Monday’s opening ones. If there’s a difference, there’s a gap.
The significance of price action gaps changes based on the difference between the closing and opening prices. Typically, the bigger the gap, the stronger its significance and the more powerful the disruption.
However, for some traders, the definition isn’t so clear.
A lot of traders consider the empty space between the last candlestick on Friday and the first one on Monday as a gap.
Moreover, brokers don’t make our life easier.
Sunday Candle and Gaps
Many brokers have decided to give up the Sunday candle in recent years.
For inexperienced traders, the Sunday candlestick is a daily candle that has only two or three hours of price action.
Because of the limited number of hours, many traders have decided to skip this candle.
After all, they say, the Sunday candle “ruins” the charts.
Almost always, it has a small real body, and traders using Japanese candlesticks patterns get confused as hammers, Doji candles or morning and evening stars often use such a candlestick.
When it comes to price action gaps, it does matter.
If trading occurs in New Zealand, even for only two or three hours, traders should know it and interpret it accordingly.
As the volume in the FX market isn’t relevant (the market is far too big for a single broker to give the volume for the entire market), we don’t really know what was the real volume traded on Sunday.
Hence, if someone traded, the info should be there- the candle should be there.
So, if interested in trading price action gaps, first make sure the charts you’re looking at show the relevant price action.
Ask your broker or set up the chart from the preferences tab to display the Sunday candle.
Important: the timeframe doesn’t matter.
As a gap measures the empty space on a chart, it doesn’t matter if you look at the hourly, four hours, or the daily chart.
A gap is always the same and trading price action gaps isn’t influenced by the timeframe.
Gaps in Forex Trading – Why Traders Fear Them
Price action gaps are one of the reasons why traders prefer to close their positions before the weekend. Some investment houses simply forbid swing traders to roll their positions over the weekend.
The problem with price action gaps is that pending orders are useless. Any broker promises to execute a trade if there’s a market.
A gap implies that there’s no market.
Hence the order will get executed when a market appears. Namely, at the opening price, including the gap.
If traders, for instance, keep a long EURUSD position over the weekend at, say, 1.1580, with a stop-loss order at 1.1550, the thirty pips stop-loss order isn’t guaranteed.
If the market forms a gap bigger than thirty pips and opens lower, say at 1.1520, that’s the level the long trade will be squared.
It isn’t funny trading price action gaps, is it?
And that’s not even the worst example.

But sometimes, the unpredictability is so tremendous that even price action cannot help you 🙂
SNB and Price Action Gaps
The SNB (Swiss National Bank) example comes to mind.
In January 2015 the SNB decided to give up on the EURCHF peg to the 1.20 level. Effectively, it couldn’t keep it anymore as the ECB prepared to ease the monetary policy further.
Despite only a few days earlier reassuring the market participants it will do all in its powers to protect the level, the SNB failed to that, and the market effectively disappeared.
A huge gap formed instantly on all CHF (Swiss Franc) currency pairs. A gap so big that it counted thousands of pips and the bottom didn’t appear for a few minutes.
It was pure chaos, with brokers and liquidity providers scratching their heads to find some quotes.
Eventually, the quotes appeared, with the EURCHF trading into the 0.80 handle.
This was almost three-thousand pips lower!!!
As price action gaps in the currency market are extremely rare during the trading hours, many retail traders had their stop-loss at or just below the 1.20.
When the market disappeared, the brokers filled the stop-loss orders at the new levels.
Imagine the losses incurred!
However, feeling the costly process of going after the retail clients, most brokers erased the negative balances.
Not all of them did that, though, and some retail traders paid a dear price for a price action gap that wasn’t supposed to happen.
Yet, it did.
Needless to say, none of the different ways to trade gaps successfully we’ll cover further on, applies to that gap.
It was an exception, only to remind us of the importance and implications of trading with price action gaps.
The Western Approach to Price Action Gaps
Not surprisingly, the Western approach comes from the way gaps are interpreted on the stock market. The overwhelming interpretation is that all gaps must be filled.
This is a powerful statement but also incomplete.
What’s missing?
The time element, obviously.
All gaps must be filled, but when?
Just like when trading overbought and oversold area, trading price action gaps following the Western approach may lead to a situation when the market stays irrational more than the trader remains solvent.
This four-hour GBPUSD chart shows two gaps forming with the market taking some time until “filling” or closing them.
It took almost one month in each case to fill the gaps.
In other words, in the first instance, traders using the Western way to trading price action gaps, just sold all the way up on the belief that the market will go for the gap’s closing.
The second example shows the opposite, with traders buying aggressively to close the gaps.

Just go on any currency pair and have a look at historical data.
You’ll find out that plenty of gaps took a year or even more to close. Trading against such a time span leads to retail traders losing their trading accounts for sure.
There’s also a controversy regarding how to trade gaps successfully with the Western approach.
Some traders argue that the gaps must close the same Monday they form. If not, any trade must be closed at the end of the trading day.
Some others say, on the contrary, that the weekly close is relevant for gaps’ interpretation.
Finally, a third group of traders argue that only after a month, or at the month’s closing, any trade related to a possible gap must be closed if the gap wasn’t filled.
With so much ambiguity, it is no wonder the Western approach leaves a lot of room for interpretation.
However, that’s not the case when using the Japanese technique for interpretation.
Gaps in Japanese Technical Analysis
Called windows, gaps are continuation patterns in the Japanese technical analysis.
Trading gaps in Japanese technical analysis uses the direction of the main trend and the price action gaps as a confirmation of the trend’s strength.
If the market was so strong to open with a gap, it means the underlying trend is powerful enough to guarantee trading in the same direction.
Funny fact: The Japanese call a window the empty space between the Friday’s closing candle and the first candle when the market opens on Monday.
The bigger the gap, the more powerful the implications for the future price action.
The Japanese also have another interpretation to price action gaps.
Not only they look at gaps as continuation patterns, but also use their edges to trade gaps as reversal patterns.
In earnest, they interpret the edges as support and resistance when trading gaps.
Remember: Not all gaps are the same.
For instance, the same GBPUSD timeframe shows four different gaps, with the last one where the question mark is located, being the widest one.
The first thing to do when trading price action gaps with the Japanese approach is to mark their edges on the chart.
The distance between the two edges forms the window.
The window in its turn acts as a continuation pattern.
Check the chart above: the market gaped lower, it bounced off and filled the gap according to the Western interpretation.
It effectively collapsed afterword confirming the Japanese interpretation of price action gaps as continuation patterns.
Important: Windows offer strong support and resistance for future price action.
The bigger the distance between the upper and lower edge of a window, the stronger the support and resistance is.
Also, when broken, support turns into resistance and resistance into support.
Practical Example of a Price Action Gap– The Brexit Gap
The best way to go through technical concepts is to use examples.
As such, I’ll use the most famous gap that ever formed in the recent history: the Brexit gap.
In June 2016 the United Kingdom voted to leave the European Union. Because the referendum took place during the trading week, no gap appeared until the following Monday.
The first thing to do when trading price action gaps with the Japanese approach is to mark the edges of the gap.
This in other words means to measure the empty space between them.
The resulting lines form strong support or resistance levels. In this case, strong resistance, since the gap was bearish.
For over three months the market tried to break the resistance provided by the gap area.
It failed every single time!
Moreover, the rejection was so strong that the infamous GBP flash crash in October of the same year sent the pair down to 1.17 area, only confirming the power of gaps as continuation patterns.
Almost one year after the infamous flash crash, the GBPUSD pair had the power to come to the Brexit gap again.
The beauty of interpreting price action gaps with the Japanese approach is that the resistance and support levels remain in place forever.
In this case, the market turned right from the resistance area, proving the power of trading gaps as reversal patterns.
By December, the Brexit gap acted once again as resistance, only to turn into support ahead of the GBPUSD breaking higher to over 1.40.
But then again, on the move back to the downside, where do you think the price hesitated?
You guessed it, right on the Brexit gap.
This time the two edges of the gap acted as support.
The market formed a bearish, descendant pattern: a descending triangle.
It took its time to consolidate, but it formed a series of lower highs in the meantime while keeping a horizontal base.
That’s the definition of a descending triangle, with the Brexit gap acting as a support for its base.
Conclusion
By now, you should have an idea why price action gaps are so controversial patterns.
What’s fascinating is that despite the liquidity and super-execution that exists in today’s financial markets, gaps keep forming.
Under the ECN (Electronic Communication Network) and STP (Straight Through Processing) technologies, brokers get quotes from a liquidity pool where more liquidity providers participate.
The idea is to fill the client’s order with the best quote and make sure there’s a price for every level.
Yet, gaps do form with the speed of the market moves also improved.
It is strange that we use techniques for interpreting price action gaps that have existed for hundreds of years.
But as long as they work, they’ll remain in place.
To sum up, price action gaps are here to stay, despite improvements in the execution technology.
Either trading them using the Western or the Japanese approach, there’s always subjectivity in place.
There are no rules to trade gaps. There is not a single method that prevails.
Because rules make up a trading strategy, the lack of them leads to random trading.
For this reason, today’s traders use gaps mostly for scalping purposes, rather than swing trading or investing.
If they see a reversal or continuation pattern forming in the area of a previous gap, that’s another factor to come and reinforce a trade.
Interpreted alone, gaps are nothing but empty spaces on a chart. It is up to each and every trader to make something out of trading price action gaps.








What is being referred to here are known as “common gaps”. They can occur at any point in the price action trend.
In western technical analysis, there is also a grouping or set of three related gaps which I have collectively dubbed as
the “trend trio”. They do not occur very often but they only do occur in very long term price swing trends & can be used to measure price targets. The space occupied by the ensuing “window” gap tends to be somewhat larger than the typical common gap.
This gap set often begins with the “Breakaway” gap or else it soon appears early on in the swing move. Then about midway into the swing move, another gap known as the “Midway Measuring” gap forms which signifies that the ultimate destination or target price can be determined simply by measuring from the swing low up to the mid point measuring gap (or vice versa in a down swing trend) and projecting that same distance up to the projected target price on a measured move basis. Then as the swing nears it’s projected target price point, an “Exhaustion gap” will appear beforehand to signify that the trend will be ending soon. I have found these to be extremely accurate and reliable over the years for analysis purposes whenever they can be found, which regrettably is not often enough for me.
I regard them as veritable “jewels” when so found and need to be treasured and relied upon by traders.
Thanks to Colibri for the explanation of the Japanese interpretation of gaps. That I did not already know.
Thanks again for passing that knowledge along to us all.
Hi Ed,
That was a wonderful comment! Please have more of those coming, since that helps a lot to the trading community. I only have limited time to describe a certain topic and this topic took me close to two weeks to research and complete. As you can imagine, I do trade during the day, as well 😀 and that makes my time even more limited to try to transfer my knowledge and research onto other aspiring traders. Comments are really important, so feel free to share your thoughts or just PM me at admin@colibritrader.com in case you have any more concrete questions.
Thanks and talk soon!
Just a few late thoughts to clear up possible ambiguities about “trend trio” gaps that I neglected to mention in my earlier posting. First, of course these gaps do actually occasionally show up on short term or intraday minute or hourly charts as well but that is very rare and these gaps need to be seen on longer term charts to see the depiction of the full price swing showing atleast two or preferably all three of these gaps taken together. Remember that they are true longer term indicators and I have never seen a complete set of all three trend trio gaps appear on any short term or intraday charts in my over three decades of computerized trading. A complete set of all three trend trio gaps taken together may rarely appear on a Daily chart but they are most likely to appear on the weekly and monthly charts as they are true longer term indicators.
Second, common gaps are very frequently filled by subsequent price action whilst in the very same price swing leading some to claim that common gaps always get filled. My findings are that whilst this is mostly true, it is not always so. Sometimes a common gap may only partly get filled on rare occasions or not filled at all in the same price swing. Trend trio gaps on the other hand, are never filled whilst still in the very same price swing. They only get filled after price reverses in the opposite direction in a new reverse or corrective action price swing. This is a very important and significant distinction between trend trio gaps and common gaps. Hope this helps to clear up any ambiguities about trend trio gaps.
Hi Ed,
These are some very good thoughts! I am sometimes open to guest posts in case you feel you can really contribute to other traders with your knowledge. If you want send me an e-mail. Regards, Colibri
Concerning our “trend trio” discussion depicted above, I would further like to mention that a POTENTIAL BREAKAWAY GAP has just opened up this weekend in the CL OIL market. For interested traders, this timely development will bear watching as once again it could ultimately prove the validity of this “trend trio” concept in “real time” as price discovery action events unfold. To recap the recent price action which to me looks like a POTENTIAL BREAKAWAY GAP has just opened up, let us quickly review the facts. On a one minute chart of CL OIL, just before the close of trading on Friday last, being November 11th of 2018, at the 16:59 minute time bar EST, the following prices are displayed > O = 59.82, H = 59.83, L = 59.78 & C = 59.81 with a closing settlement price of 59.82 at the 17:00 minute time bar EST. So the market continued to look very bearish to traders at the Friday close & over the weekend even after a 20% price drop since the 76.88 price high on October third last. However the OPEC meeting concluded over the weekend & they indicated that Saudi Arabia was going to cut oil production by 500,000 barrels per day. Now when the oil market resumed trading on Sunday night at 18:00 EST, oil prices GAPPED UPWARDS. Here are the prices of the opening 18:00 minute time bar EST, O = 60.74, H = 60.89, L = 60.58 & C = 60.80. So the difference or gap in price between the Friday close & the Sunday evening opening is 60.74 – 59.82 = 92 cents per barrel of oil. The 92 cent size of this gap is larger than is usually found in most “common gaps” in the oil market & thus to me, it may very well qualify & has the potential to prove to be a BREAKAWAY GAP & the start of a major new BULL SWING RUN in crude oil after the severe 20% pullback of October. When measured from the Friday close at 59.82 to the low price of the opening bar at 60.58, the gap is 76 cents, still a larger than normal common gap number for the oil market. However, there is need to be cautious of this move because my trading experience tells me that such BREAKAWAY GAPS usually occur at the very start of a new bull market & the oil market has been in a major bull market run since February 11th of 2016 when price bottomed at $26.08 per barrel. None the less, after such a severe pullback, it may very well be that a new bull swing run has now just started. Time will tell as always. Watch for a MIDWAY MEASURING GAP to appear if & when price advances significantly as it will indicate the final target price for the bull run & ultimately thereafter the famous EXHAUSTION GAP as price tops out at the nadir of the price swing. Good trading as always.
Wow that was fast, we got our answer about whether or not the weekend gap in the CL OIL market was a BREAKAWAY GAP or just a normal common gap & as price has recently just fallen back to completely close the gap window, we now know that this oil gap is just a common gap that is now closed & so it never was a BREAKAWAY GAP as I had thought it might prove to be.
The market always knows what it wants to do & we just try to figure that out beforehand.
just tested the Gap! it really works! but it have to combine with another analysis, very complicated though! but the gap, actually something like leads! or insight what next move! I try 10 gaps, and it seem, 80% works, 20% fail! but if we implement good money management and put Sl, I think trading gap, really works, for swing trader! not sure for scalper, because to risky!
anyway thanks for the info, I really agree with your statment! which one ? you guess 😀 heheee
Hi Harrist, thank you for your feedback! It really means a lot when traders have used this approach and can confirm its application. Please let me know if you have any other enquiries and feedback regarding anything else. Would be happy to help 🙂