Moving Averages 101- Pros and Cons
I have already written an article on moving averages previously.
Moving averages are a very popular approach to trading.
They are also a very misunderstood concept and a lot of traders only claim to know how to use them, but are missing the most important point.
Moving averages are a lagging interpretation of market movements and as such, need to be seen through their weaknesses.
Just like any other strategy, moving averages have a lot of pros, as well, but you will need to keep on reading in order to find out about those.
Happy trading!
****DOWNLOAD THE FREE MOVING AVERAGES PDF EBOOK
Contents in this article
- #1: Types of Moving Averages
- #2: Using Moving Averages with Indicators
- #3: Using Moving Averages with Support and Resistance
- #4: Using Moving Averages with Supply and Demand Zones
- #5: Moving Averages and Money Management
- #6: Bull Markets and the Golden Cross
- #7: Bear Markets and the Death Cross
- #8: Best Moving Average for Day Trading
- #10: Best Moving Average for Long-Term Trading
- #11: Typical Moving Averages Mistakes
- #12: Summing it all up- Best Moving Average
Types of Moving Averages
There are a few different types of Moving Averages and amongst them the most famous ones are:
1) Simple Moving Average
2) Exponential Moving Average
3) Multiple Moving Average
From my experience, probably the two most widely used types of moving averages are Simple and Exponential.
So, for the sake of simplicity, I will stick to those two types in this article.
Simple Moving Average
The simple moving average just averages past data.
As the simplest moving average out there, it is also the most popular kind.
A simple moving average calculates the average selected period of prices.
For example, a 50-day simple moving average would select the past 50 days of data (usually close of the day) and will plot the MA-line accordingly.

The Simple Moving Average is a preferred choice amongst the longer-term traders.
Exponential Moving Average
An Exponential Moving Average is a variation of moving averages- one that gives more weighing to recent data as opposed to all data.
Since the Exponential Moving Average gives more weight to recent data, it is more sensitive to the recent price moves.
This makes the Exponential Moving Average a preferred option to many day traders.
Multiple Moving Average
Moving average combinations are divided into “slow” and “fast”.
Here is an illustration to show you how they look:
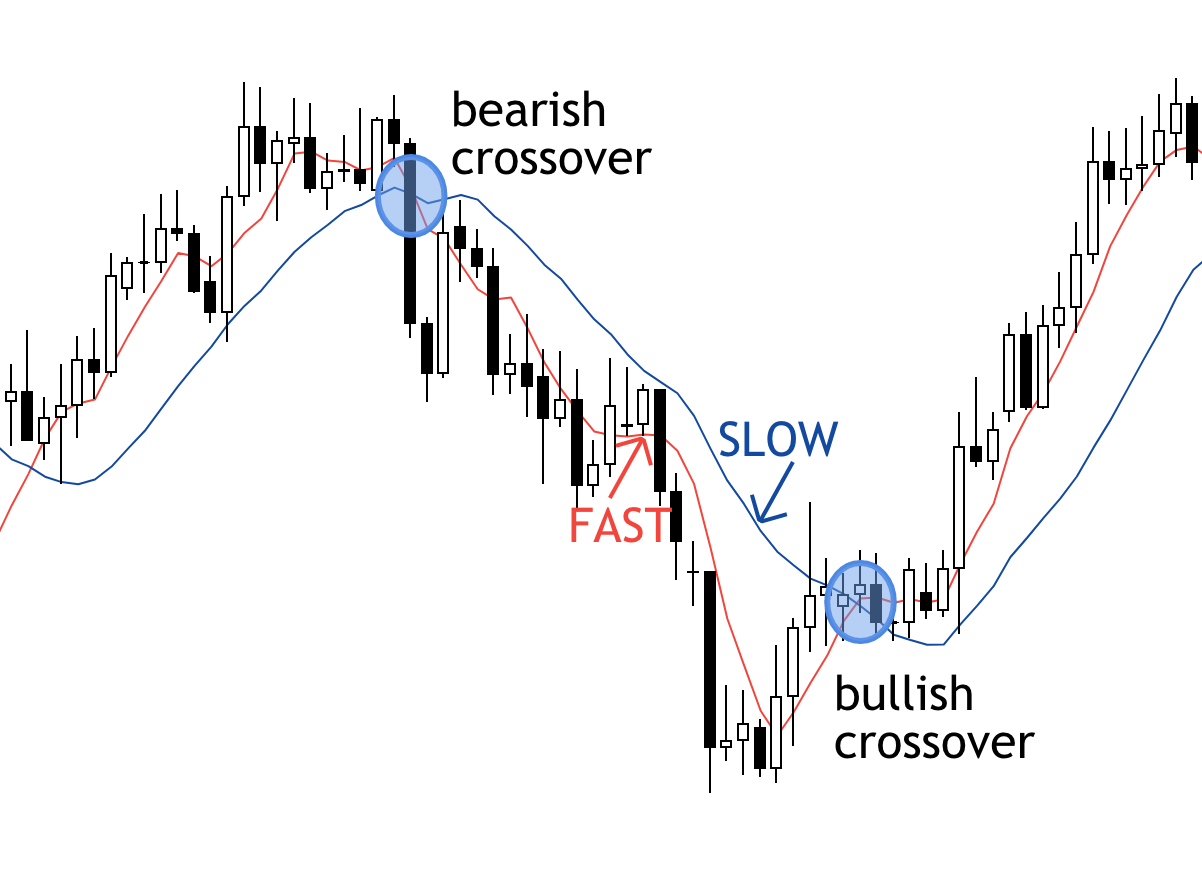
The use of slow (red) and fast (blue) moving averages appeared when a combination of two or more averages were used on the same chart.
As a general rule of a thumb, the faster moving average, the lower the time stamp.
In other words, the faster the moving average, the faster the line changes.
On the other hand, the slower the moving average, the higher the period that it is used.
For instance, if we have 50-day moving average and 200-day moving average, the 50-day moving average would be the faster one.
The 200-day moving average is the slower one, since it takes more time to affect its curve.
Here are some popular combinations of moving averages:
5-day and 8-day
50-day and 20-day
50-day and 200-day
Using Moving Averages with Indicators
The use of moving averages in combination with indicators is widespread.
In fact, there are a few popular indicators that are used in conjunction with moving averages.
Amongst the most popular ones are:
As many of you know, I am not a big fan of over-cluttering charts.
I prefer simple and tidy charts that are easy to spot a market trend.
Probably the most widespread way to use moving averages is in combination with Bollinger Bands.
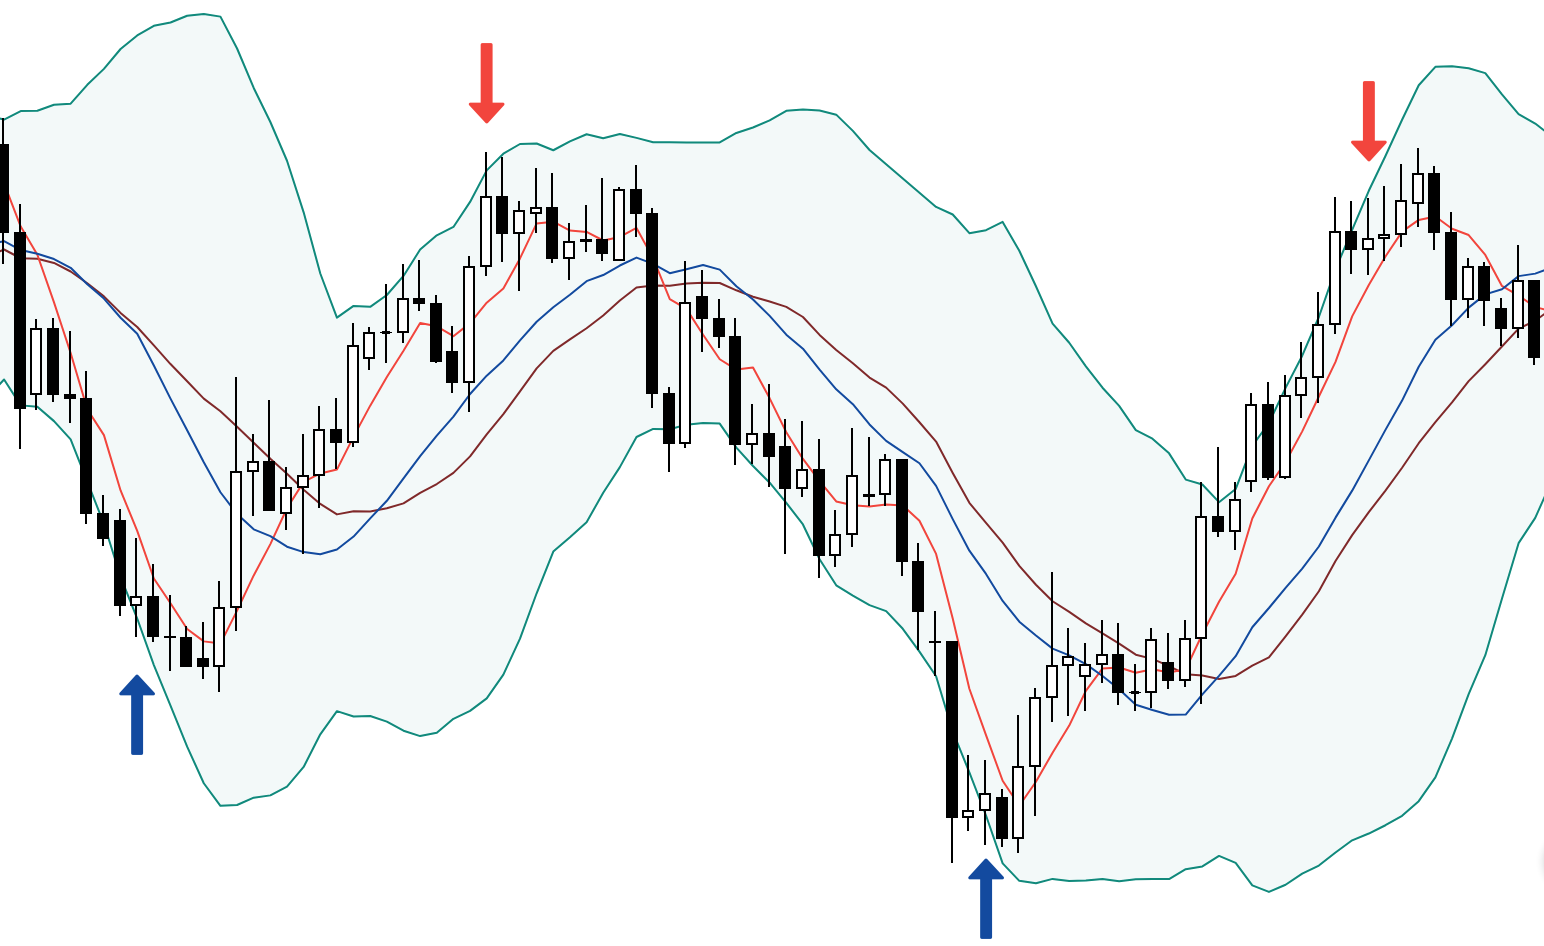
Here is an illustration of how both are used together:
Bollinger Bands were developed and copyrighted by famous technical trader John Bollinger.
A Bollinger Band is usually defined by a set of lines plotted two standard deviations (positively and negatively) away from the simple moving average (SMA) of a security’s price.
It can be adjusted to user preferences.
One example of Bollinger Bands with the 20-day SMA is as follows.
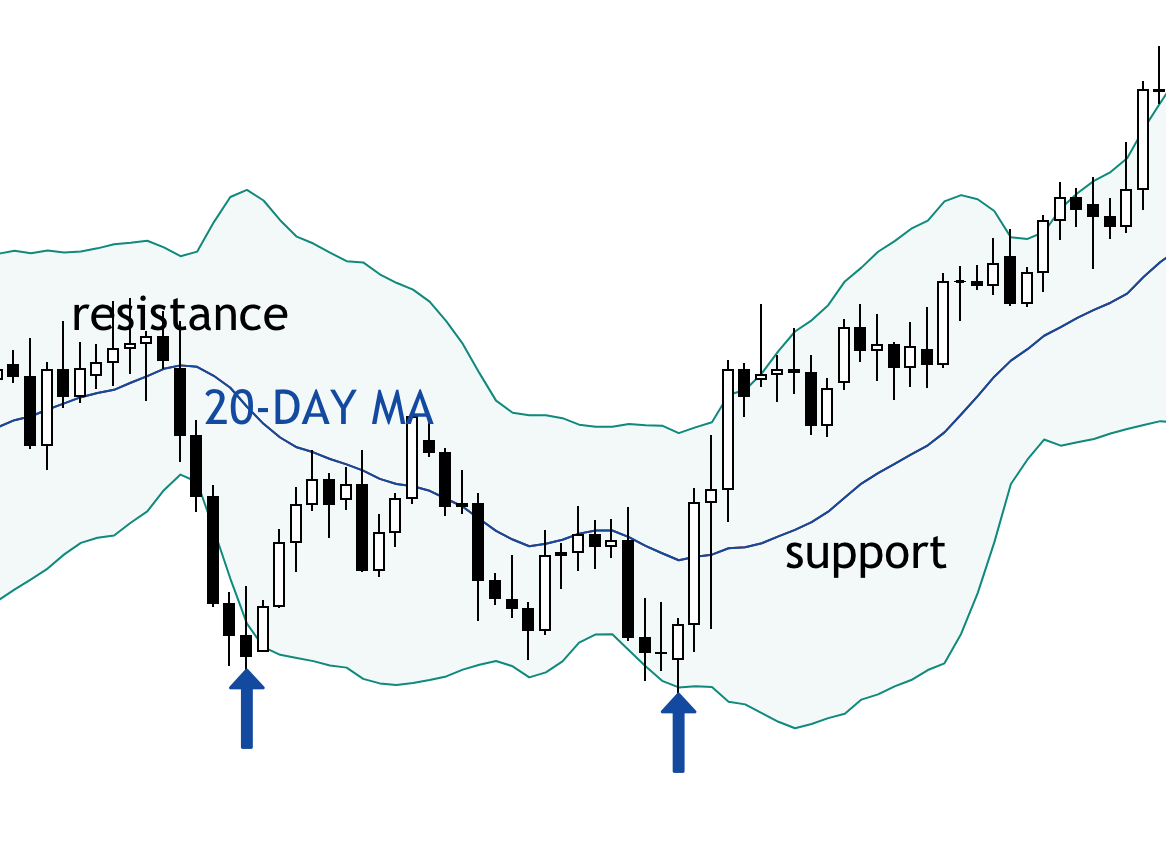
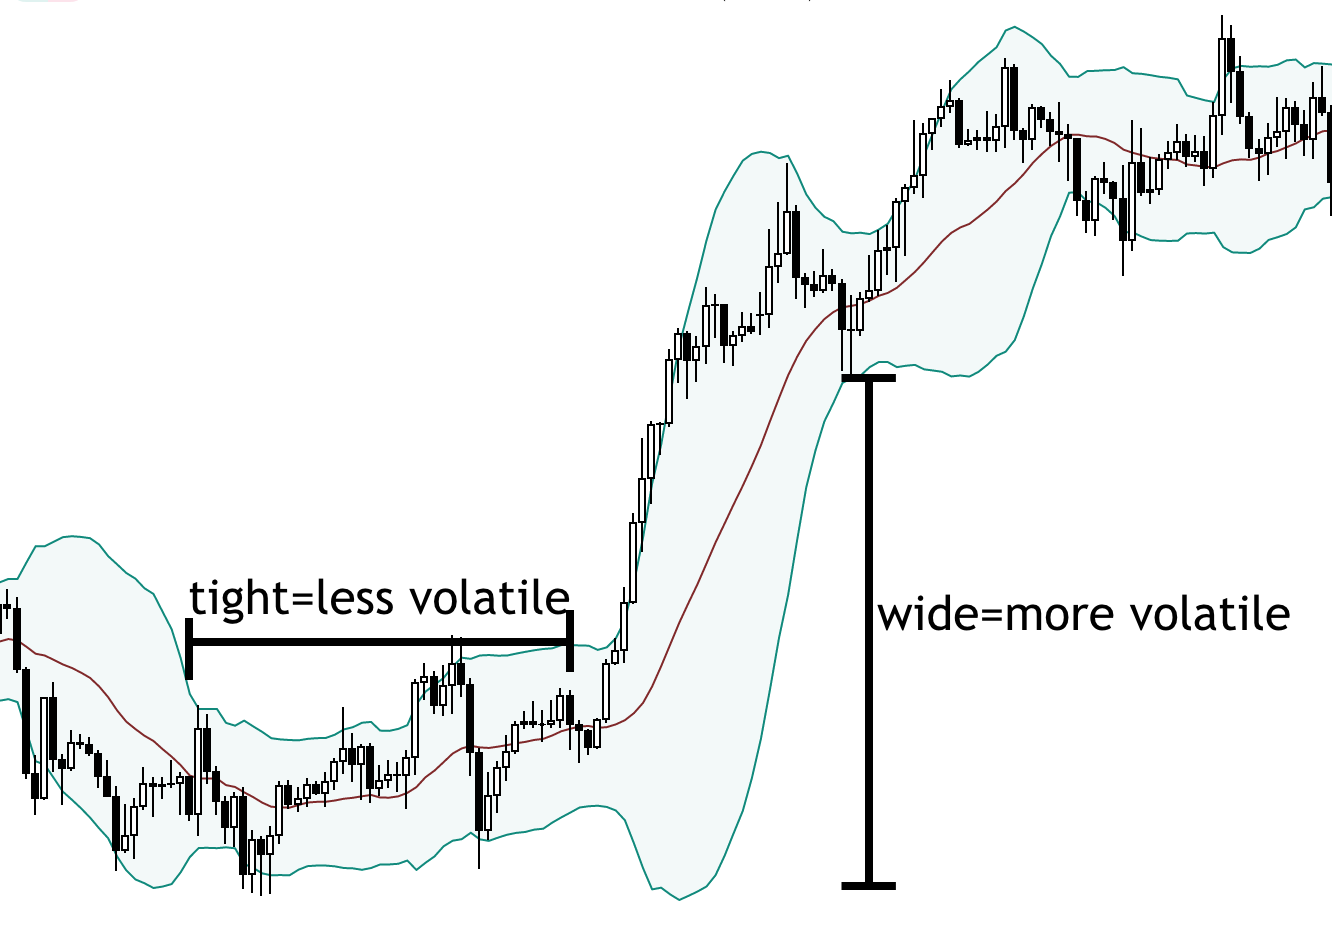
A common interpretation is that when the bands widen, the market becomes more volatile.
On the other hand, when the bands tighten, the market becomes less volatile.
The moving average is used to indicate an area of support and resistance.
It is also used by some as a signal to buy (when price goes from south to north) or sell (when price crosses from north to south).
If the price breaks the upper Bollinger Band, it means that the price is overbought and is probably time to sell.
On the other side, when price break the lower band, it is usually a bullish sign.
Using Moving Averages with Support and Resistance
Moving averages are often times used in conjunction with levels of support and resistance.
I am not going into too much detail about support and resistance levels here.
If interested, I have covered them in a long article, which you can find here.
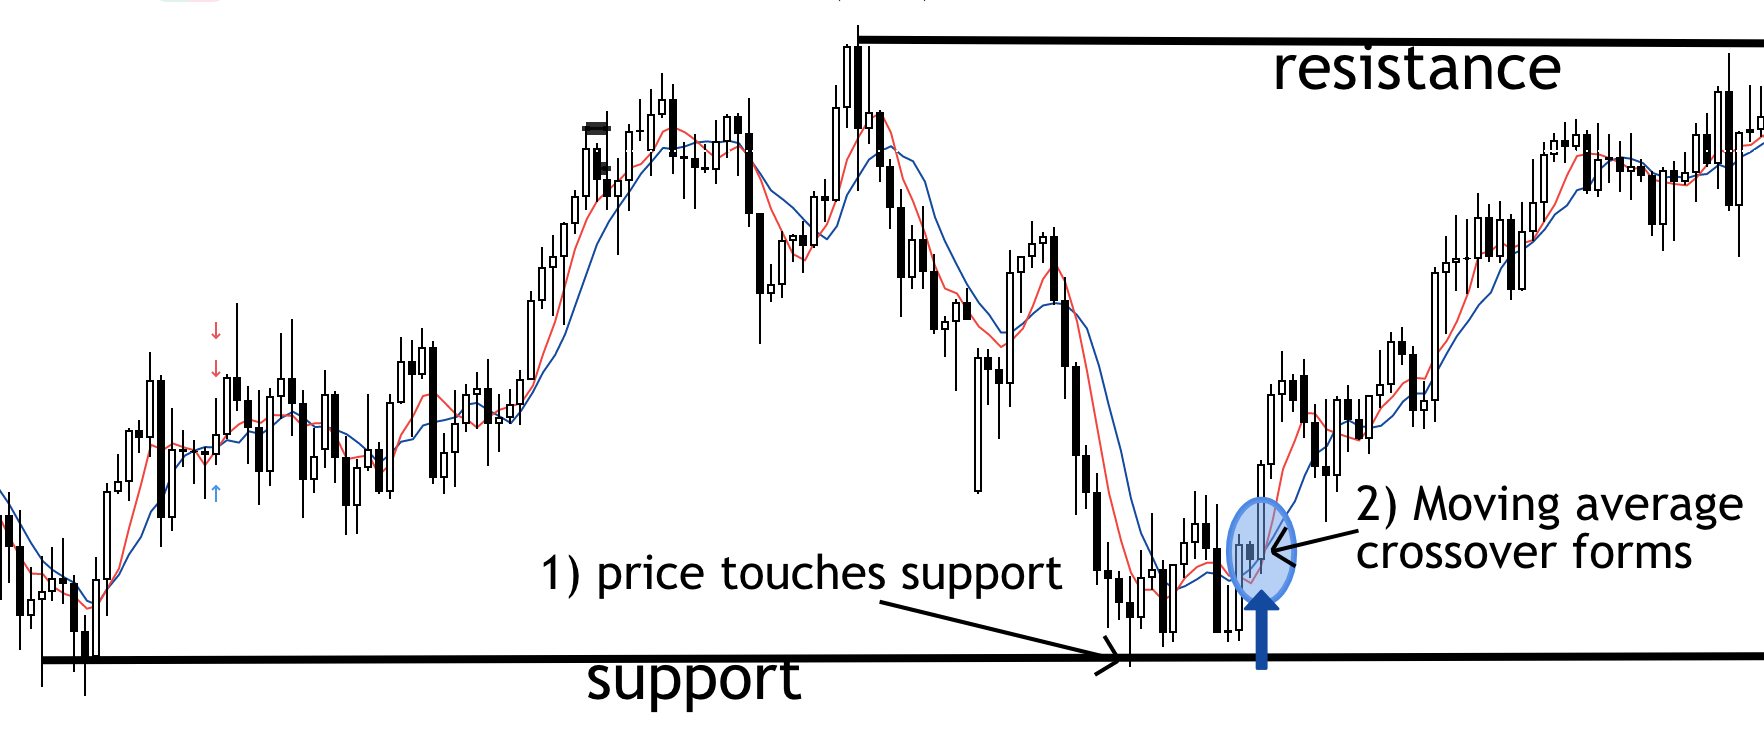
When traders are talking about a confluence area of two of more signals occurring at the same time, this means that a bullish moving average crossover might occur just above a support level.
This is considered to be an even stronger signal to go long than just a moving average crossover would have been.
Below is given the daily chart of EURJPY, which shows an example of this scenario.
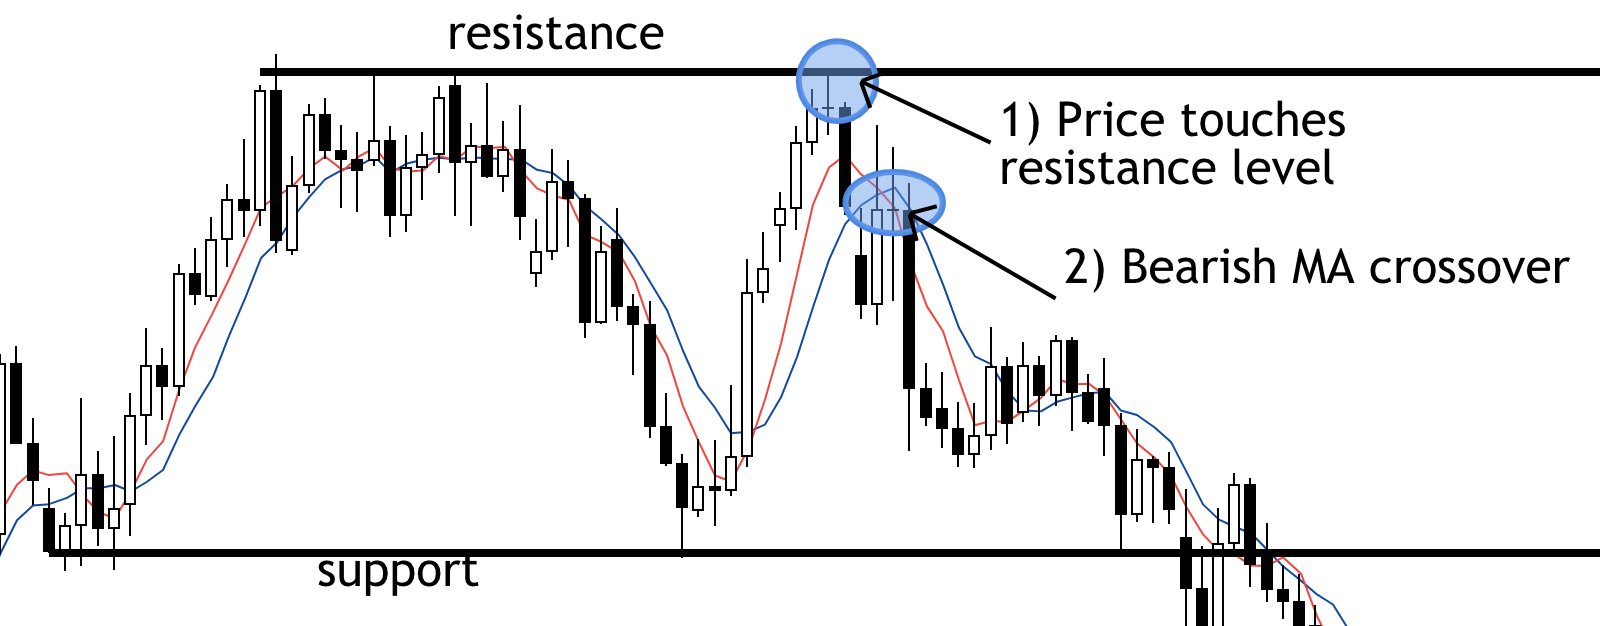
On the contrary, a bearish crossover signal occurring just below a resistance level is considered to be a stronger signal than just a crossover.
Here is an example from the daily chart of GBPJPY.
Using Moving Averages with Supply and Demand Zones
I have extensively written on Supply and Demand Zones.
I have even shared with you my way of trading with those zones over a trading course.
But, for the sake of this article, I will share with you how you can use Supply and Demand zones with moving averages.
Very similar to support and resistance, when trading moving averages in conjunction with supply and demand zones, the location is what matters most.
Location, location, location….
The Process Behind Supply and Demand and Moving Averages in Steps
- First steps is that price goes to a well established demand or supply zone and changes direction.
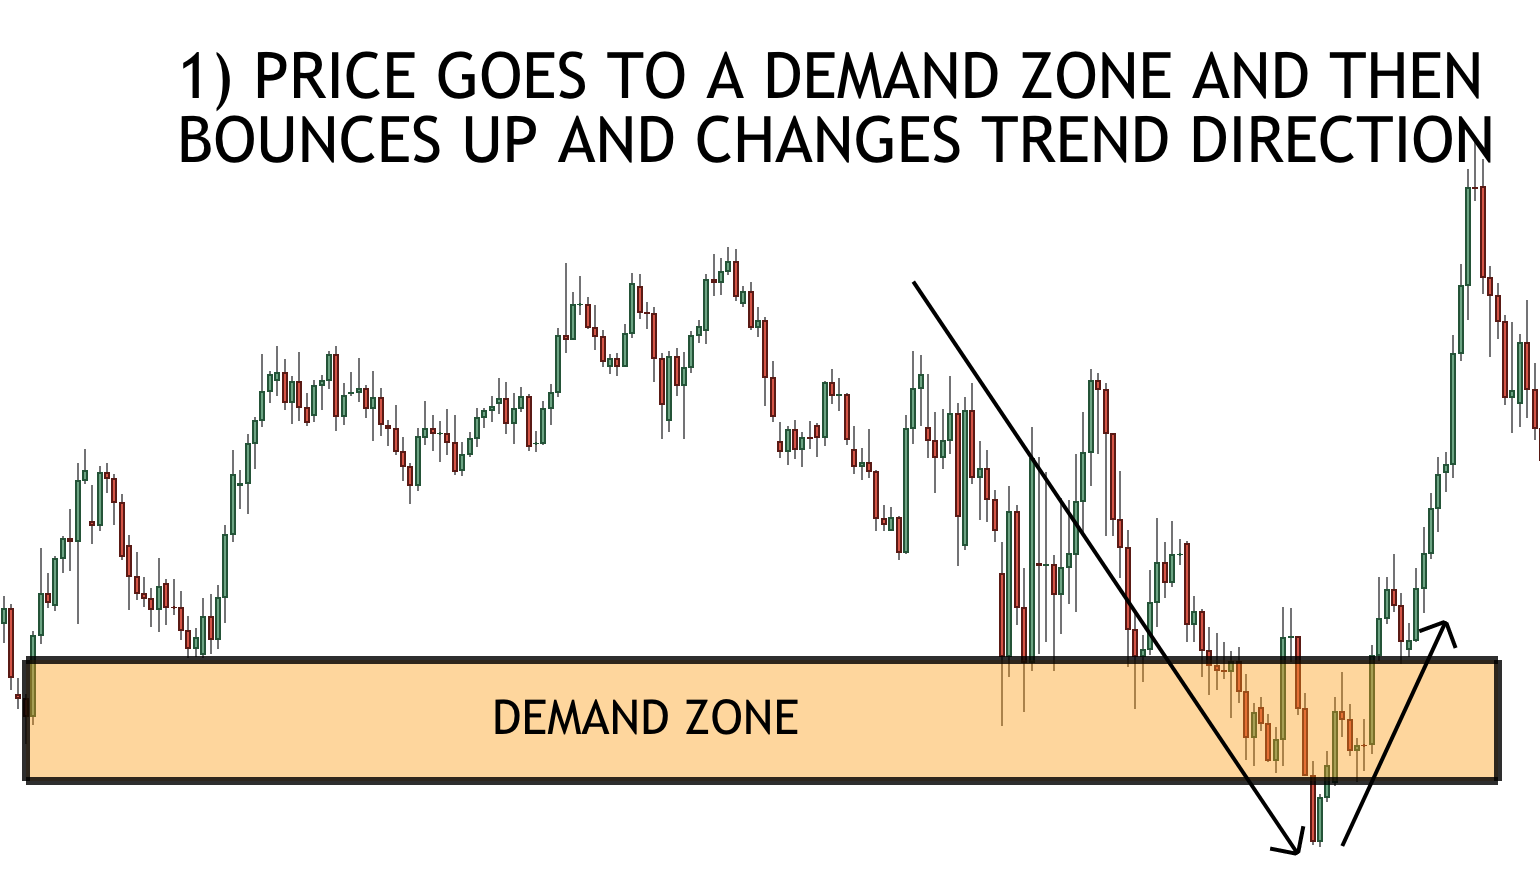
2. Second step is to plot the moving averages and find a confirmation from a crossover.
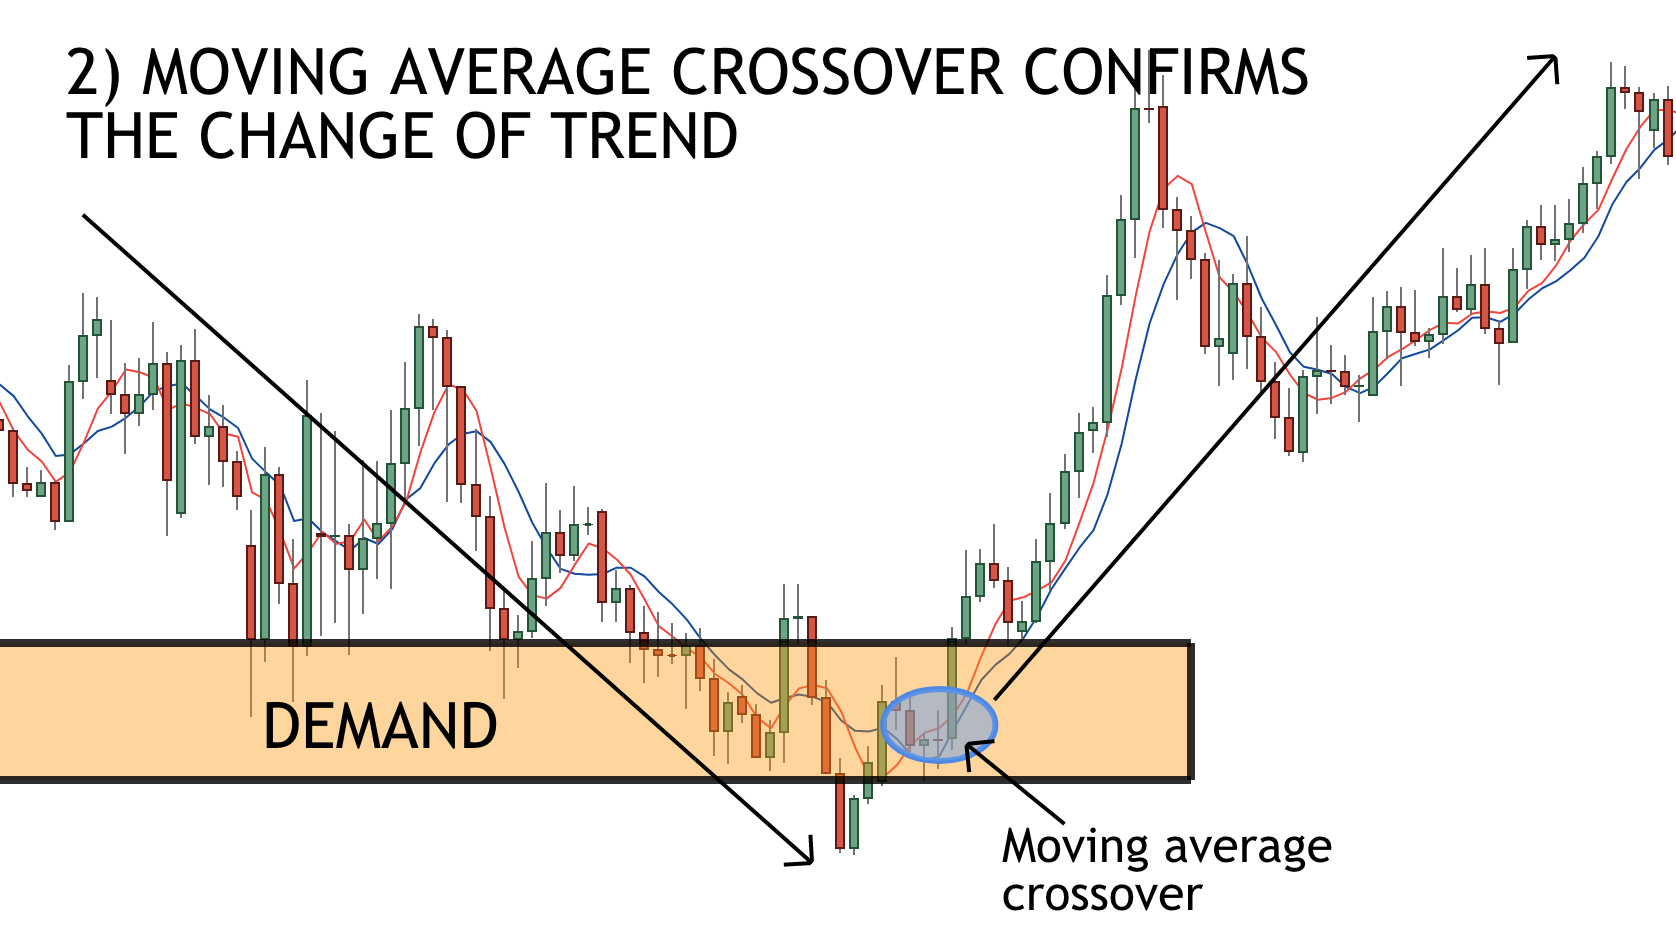
With the help of demand and supply, you will be able to sieve a lot of fake signals when using moving averages.
Here is an example of a bullish setup that a demand zone trader would have taken:
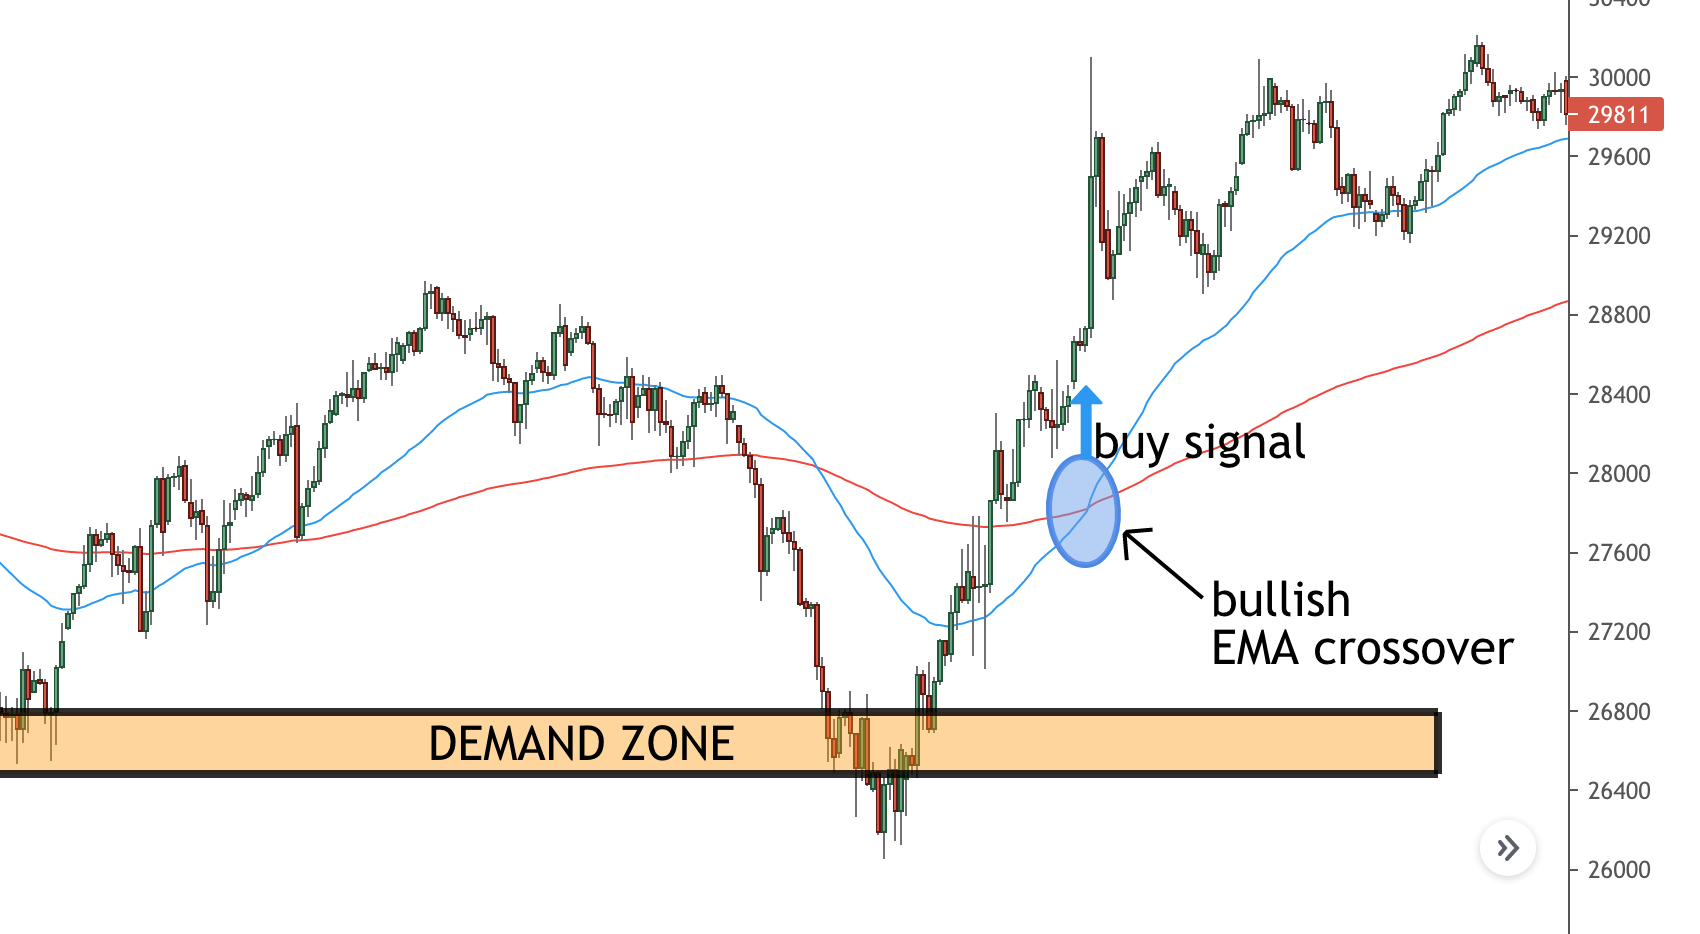
As you can see, the moving average crossover is located just above a major demand zone on Dow Jones.
After the 50 EMA crosses the 200 EMA, a lot of new buyers are rushing in and pushing the prices higher.
Let’s see an example with a supply zone now.
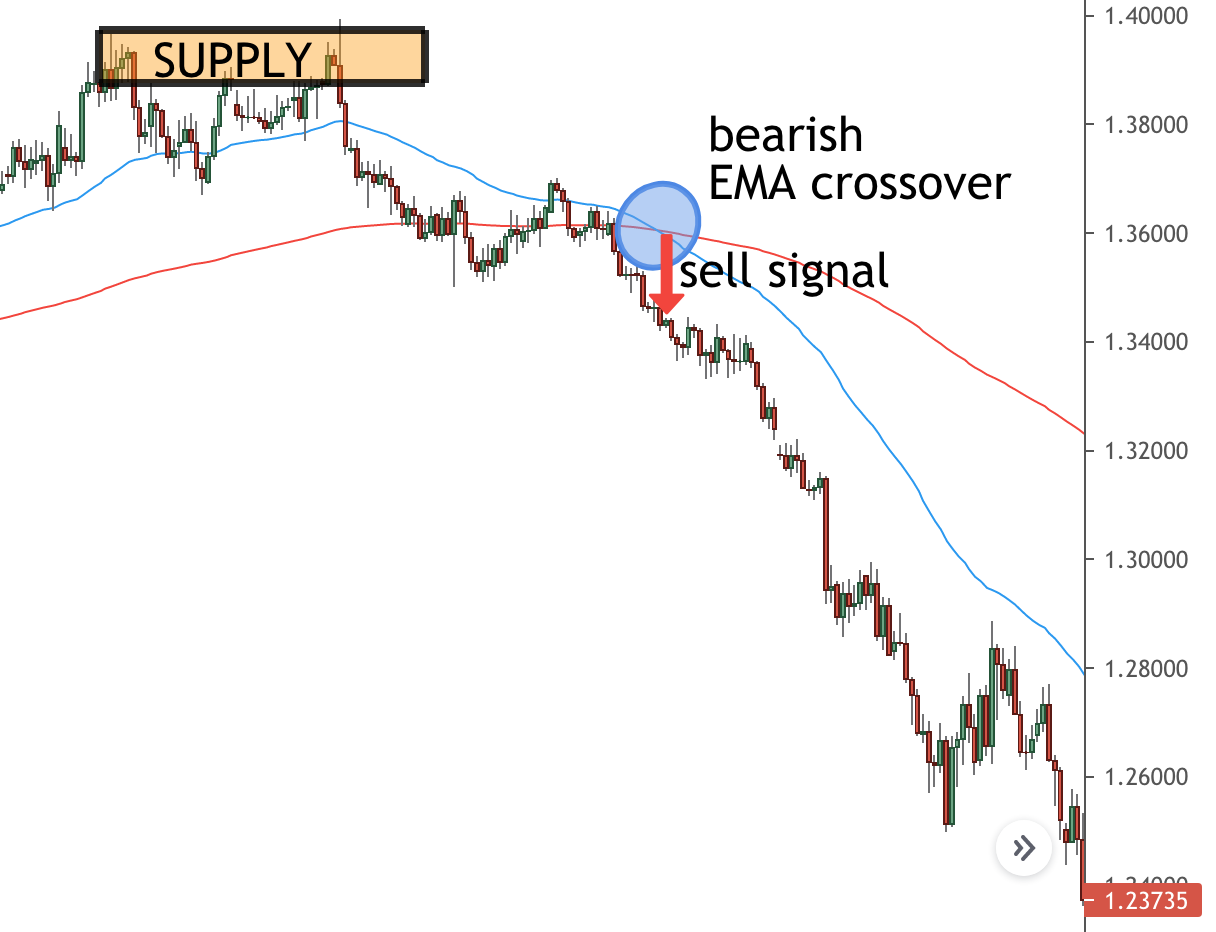
In this EURUSD example, you can see a supply zone and a crossover that occurred later.
You can clearly see an acceleration of sellers after the crossover happened.
Moving average crossovers are even more powerful when confirmed by a supply or demand zone.
One of the only disadvantages with this strategy is if you are using a long-term moving average (or over 50 periods), the signal might occur late.
But, once the right signal appears, it is usually a very strong signal that will attract a lot of market participants.
Moving Averages and Money Management
Any money management system must start with building the right expectations.
While the Forex market gives the impression of prices going in trends all the time, this is not true.
Most of the time, the forex market is trading in ranges.
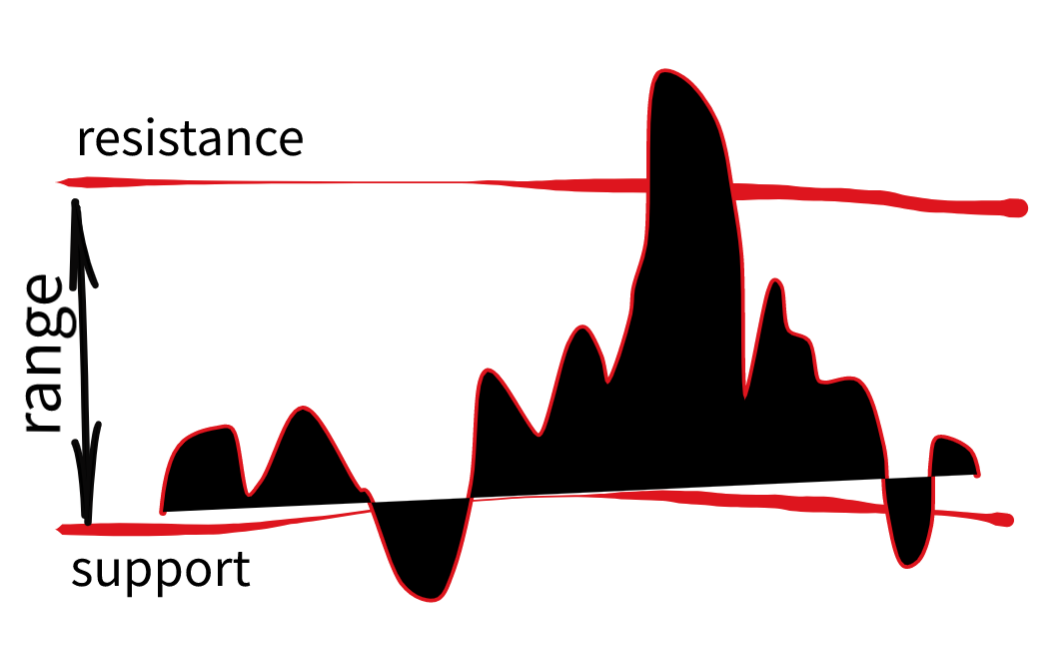
And if you know that already, it means that you need to be prepared to withstand either a lot of fake signals or adjust accordingly.
What way would you choose?
Correct:)
I would choose to adjust accordingly, too!
Here are 5 of the most important factors to adjust your money management strategy accordingly:
- Understand the market participants
- Do not risk more than 2% of your overall capital
- Use realistic risk:reward ratios
- Stick to your rules in good and in bad times
- Repeat
Bull Markets and the Golden Cross
I have a full-length article dedicated on the Golden Cross.
I thought it is extremely important to mention this here, since it is one of the most followed patterns by moving average practitioners.
Briefly, trading golden cross patterns means buying when the short-term moving average moves above the long-term one.
A Golden Cross occurs when the 50-day crosses above the 200-day moving average.
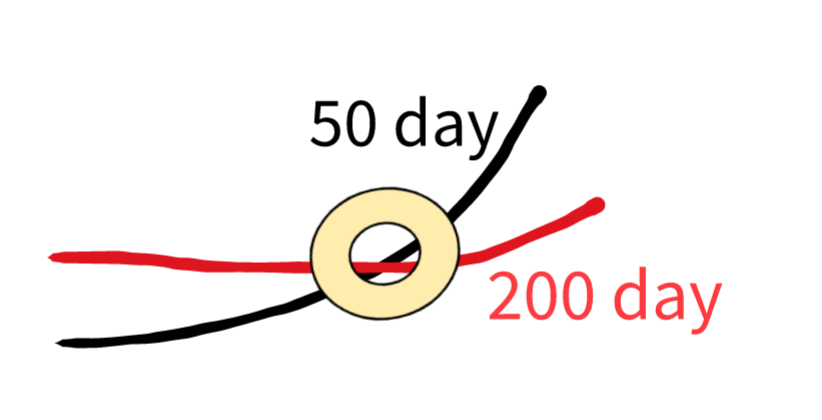
Ultra-long term traders primarily use the golden cross signal.
It is usually used in conjunction with other indicators.
Alternatively, a lot of traders are waiting for a golden cross to occur and then and looking for the price to make a dip and only then buying.
I strongly recommend you to re-visit my article on the Golden Cross, which will give you more insights and stats on this wonderful trading strategy.
Last but not least, the golden cross is a great indication and a filter for bullish markets.
Bear Markets and the Death Cross
The death cross is the opposite of the golden cross.
In order to validate a death cross signal, you need to have:
- 50-day moving average
- 200-day moving average
- 50-day crosses below the 200-day moving average
- Confirming the bearish trend
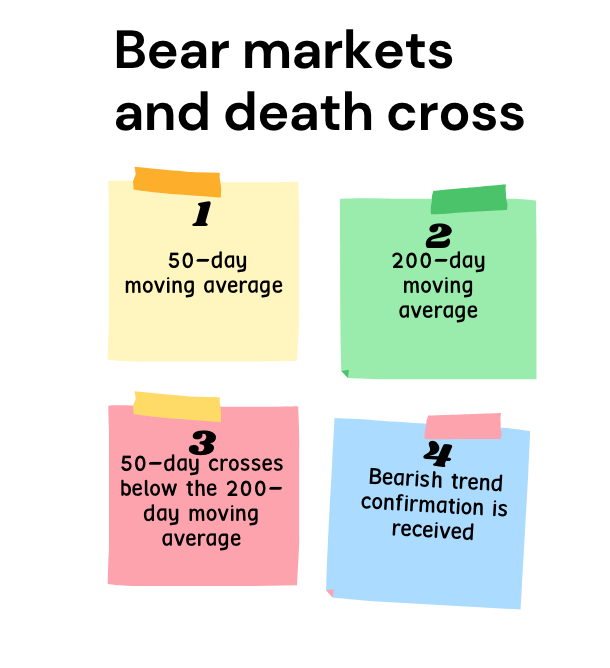
Used mainly by long-term traders and investors, this pattern is highly successful and like its brother, the golden cross is often used in confluence with other indicators.
Famous ways to use the death cross are with:
–Elliott Waves
–RSI Indicator
–Fibonacci Levels
Used by traders as major bearish market sign, the death cross is a very powerful market signal.
Best Moving Average for Day Trading
Traders usually go after a different set of crossovers when they are day trading.
Usually, the period that day traders choose is shorter than the period long-term traders use.
A popular combination is 5-day and 8-day just like the example below:
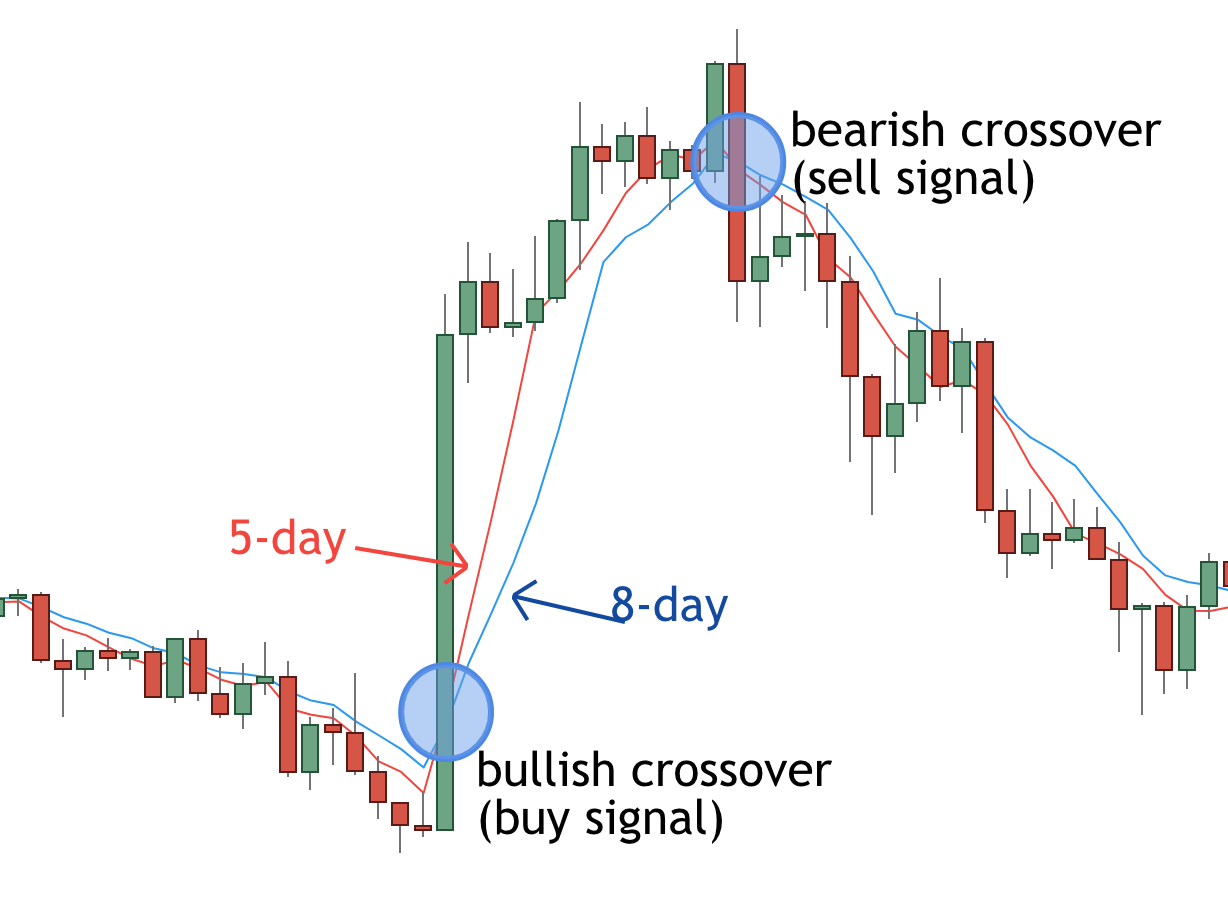
The red line is the 5-day moving average and usually day traders go long when it goes over the 8-day moving average.
On the other side, when 5-day crosses 8-day from north to south, then we have a sell signal, as shown in the image above.
Best Moving Average for Long-Term Trading
There is no such thing as the best or the worst moving average.
Some averages work better on certain instruments.
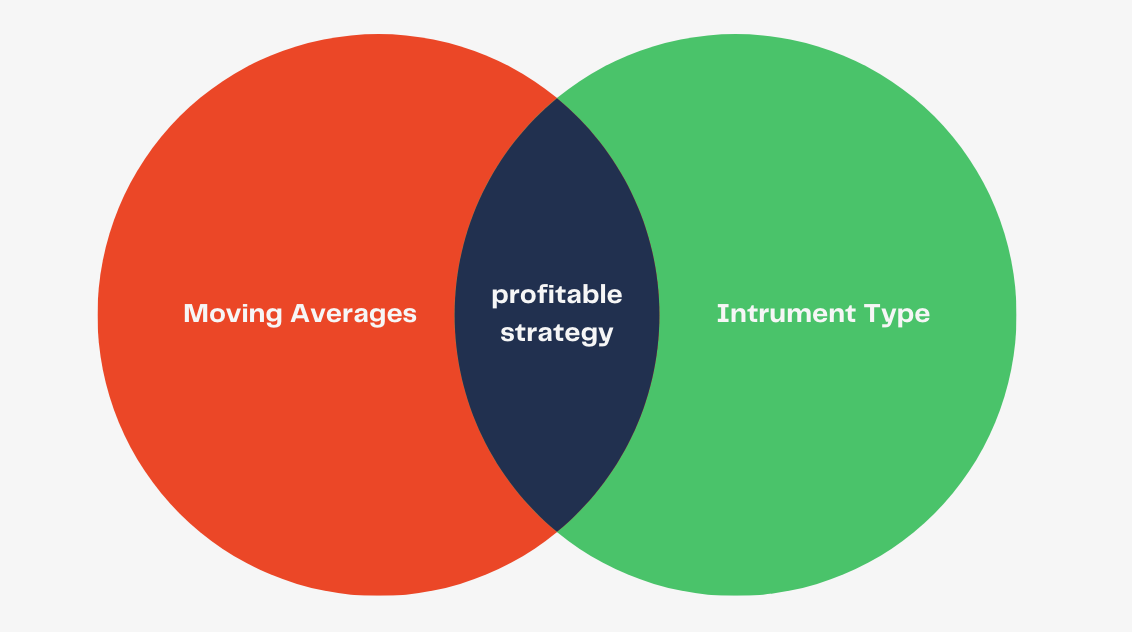
Others work better during more volatile market conditions.
But the best way to find out what works or not is to test it yourself on the market of your choice.
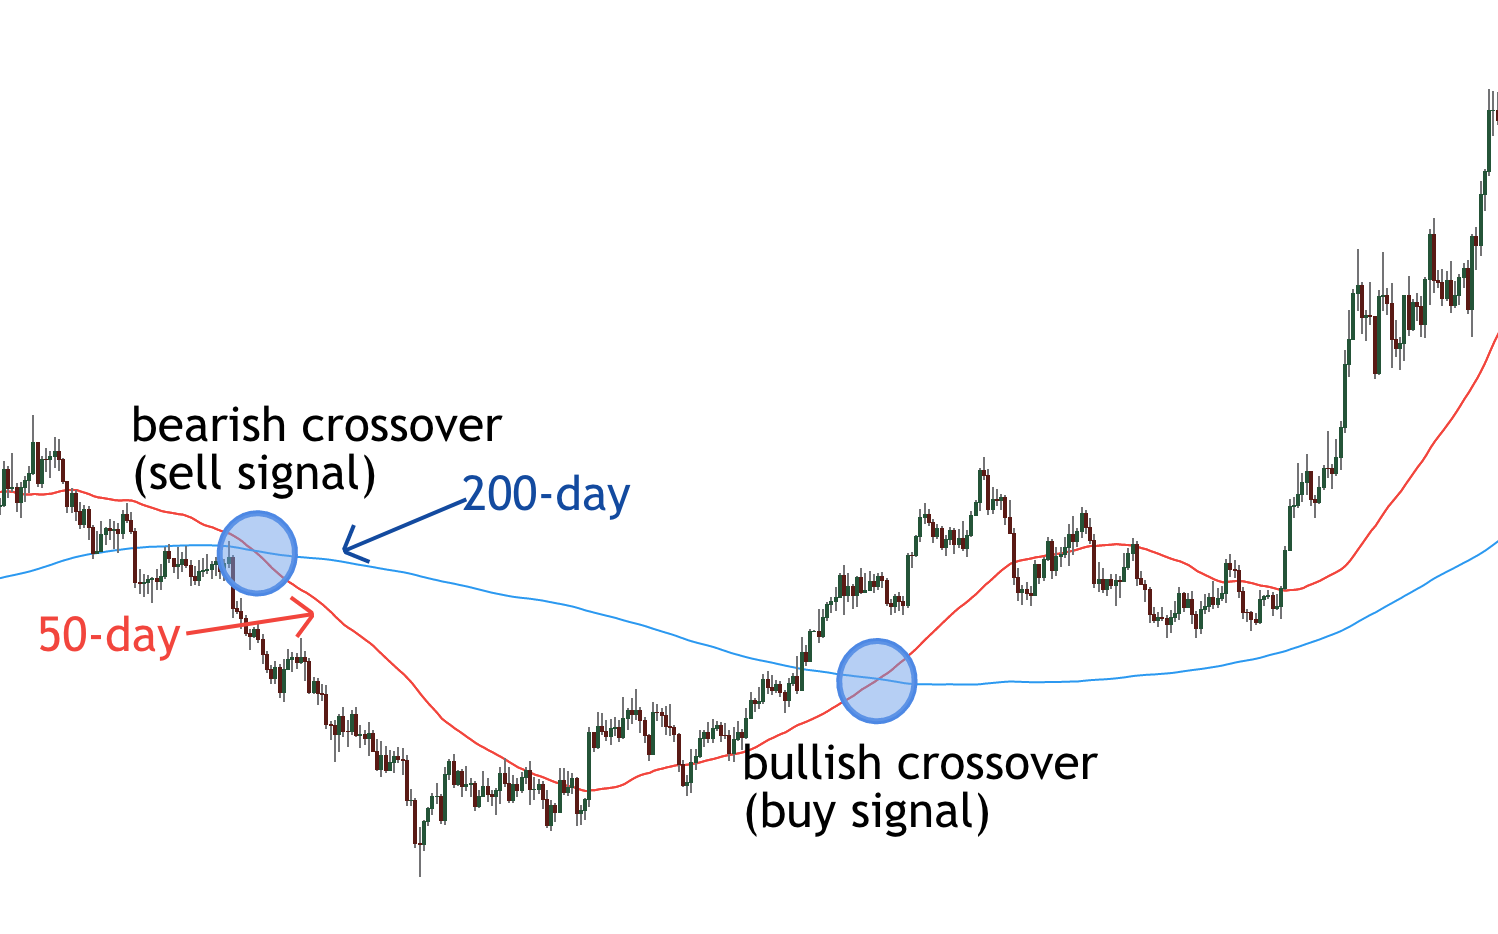
When trading in the long-term, higher moving averages usually tend to perform better and they avoid some of the daily noise.
A popular moving average combination is 50-day with 200-day as you can see plotted below on the daily Gold chart.
Typical Moving Averages Mistakes
Moving averages are considered by many to be a lagging indicator and this is especially true when it comes to day trading with them.
In other words, they are not fast enough to predict changing market conditions.
The difference between one asset to another might be huge in terms of volatility, price structure and fundamentals.
Therefore, using moving averages is very unique and there cannot be a uniform way of their usage across different instruments.
Sometimes it is hard to choose between exponential and simple moving averages.
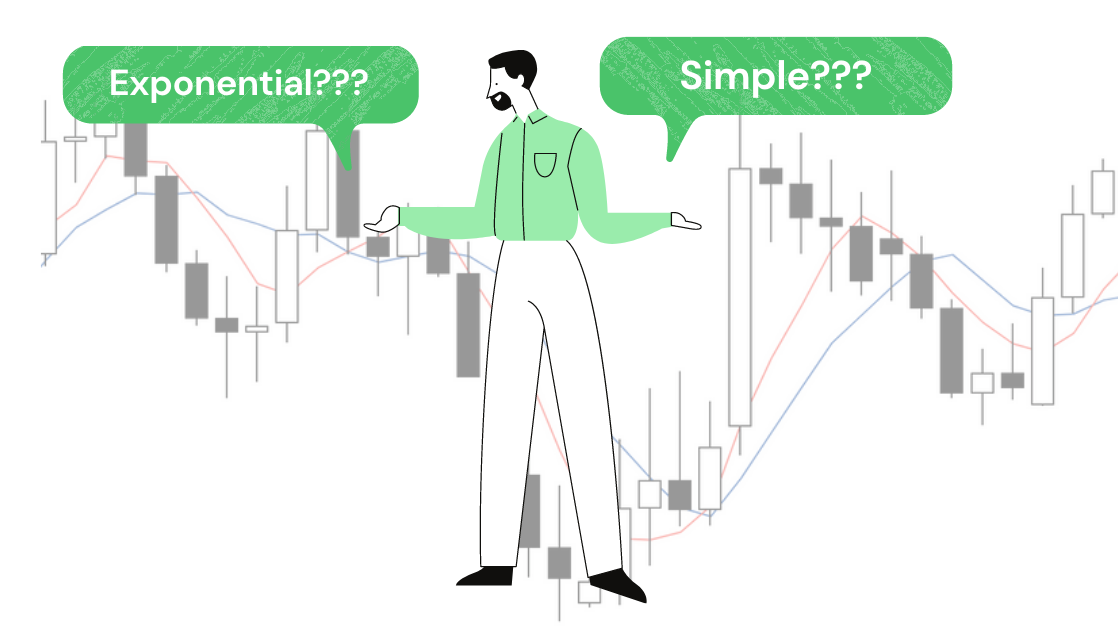
It depends on the instrument and also on whether a trader wants to place more emphasis on recent trading data versus all trading data.
Moving averages can show a lot of fake signals if the market is in a ranging environment.
Hence, the best way to use moving averages is to be very familiar with a small number of instruments and use small set of MA combinations.
Finally, it is all about tweaking them until you find what works for you.
Most Popular Moving Averages Trading Strategy
If I need to sum up what is the best moving averages trading strategy, I will have a hard time doing so.
A few guidelines for choosing the right set of moving averages is:
- First choose a market that you want to trade
- Second test different sets of moving averages (exponential vs simple) and decide which ones work better
- Test different strategies such as 50-day/200-day moving average crossover or 5-day/8-day moving average crossover
- Tweak your system and decide which one works best in the short and long-term
Choosing the right moving average strategy is as hard as choosing any other strategy.
It has its pros and cons and this is not a surprise.
What matters most is for you to decide if this is a trading approach that fits your personality and if you can tolerate the downside.
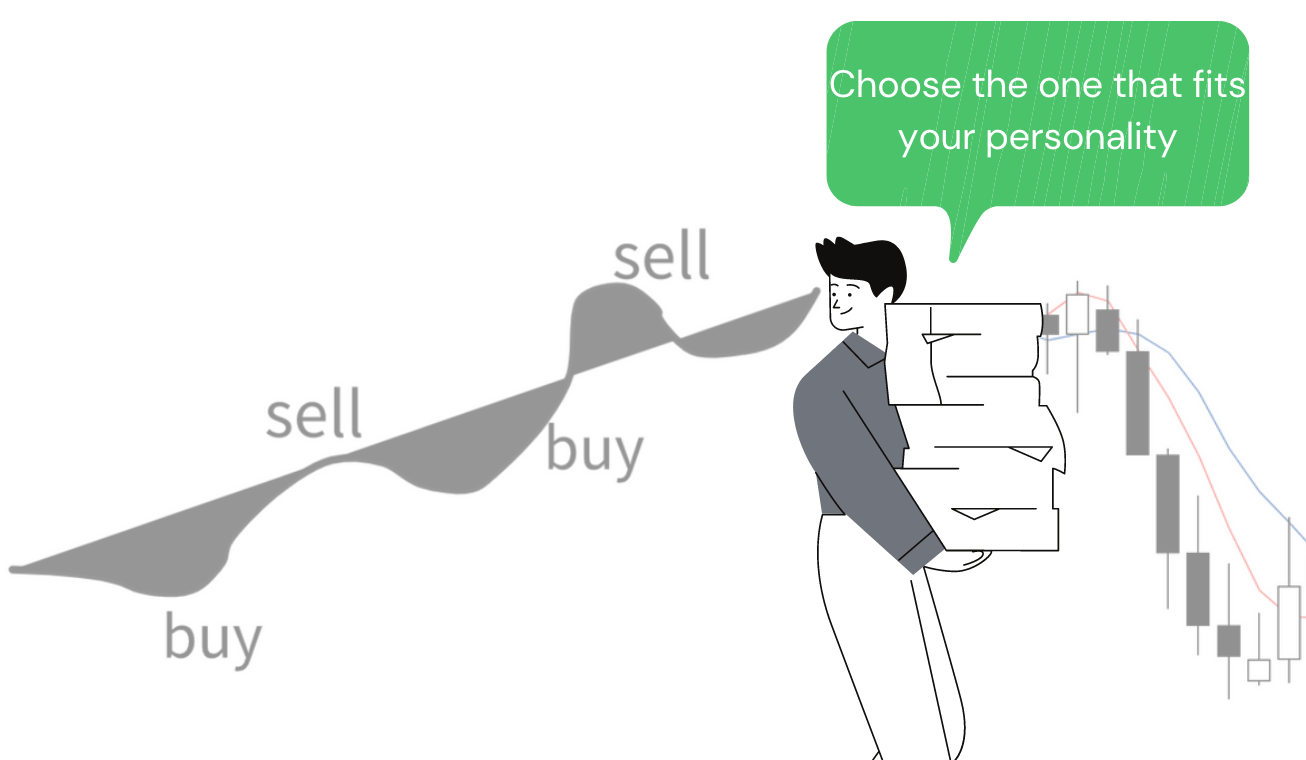
Moving averages are famous for fake signals in range-trading markets, so you will need to find a way to work around this.
Definitely not a strategy for the faint-hearted, but with the right set of tools, it could turn into a great way to reap profits from the markets daily.
Summing it all up- Best Moving Average
It would be hard to say what is the best moving average.
There are pros and cons and one needs to consider them all when trading with moving averages.
You should test different combinations of moving average crossovers and then choose the one that fits your needs.
You should also test different instruments and timeframes and see which one best fits your personality.
After all, there is no holy grail of moving averages that will answer all of your questions at once.
You will need to do the tweaking and the testing yourself.
What can help though is a trading system that has been used by someone else successfully.
But even then, you will need to test it yourself and possibly do some extra work to fit it for your trading needs.
Happy trading,
Colibri Trader
p.s.
Have you checked out my recent article on Contrarian Trading?
If you have any questions, drop me a line at admin@colibritrader.com


I love this piece.
Thank you!