EURUSD Trading Analysis
Dear traders,
Last week ended up with mixed results for me.
I had a small loss on my smaller day trading account based on a few intraday indices trades.
On the other hand, I managed to get a good return on my FX trades on my major trading account.
All in all, I was up 1 per cent, which is not the best week of trading, but not the worst, as well.
EURUSD Trading Analysis
Today, I have spotted that EURUSD has almost reached a major supply zone.
There is a bullish engulfing pattern on the daily timeframe, which in most cases is a bullish sign.
In this particular case, I am not as bullish as I would have been in other circumstances.
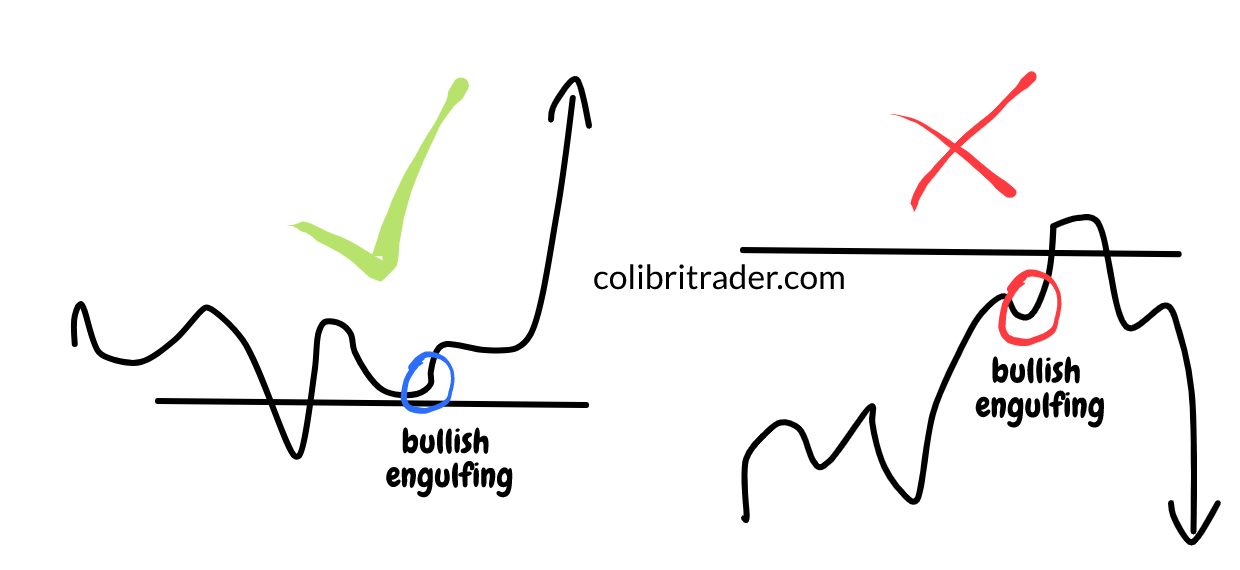
Let me give you an example of a well-positioned bullish engulfing pattern versus another example of a badly positioned one.

In the image above we have two scenarios:
- Scenario A- A bullish engulfing candlestick appears just above a support level. This gives a very strong bullish indication
- Scenario B- A bullish engulfing candlestick appears just below a major resistance level or supply zone. This does not give a very strong bullish indication
In this EURUSD setup, we have the price being located just under a major supply zone.
Therefore, Scenario B is the relevant one.
In other words, if you are taking a long trade on this occasion, the chances that you are wrong would be higher.
My ideal scenario would be if the price makes a new high and then prints a bullish rejection candle and reverses direction.
This scenario is marked by the red arrows on the image below:

Don’t forget that the blue-arrowed scenario is also a possibility, so I would be extremely careful this week.
Usually volatility might be higher around areas of a strong supply or demand and this is exactly such a place.
Let’s see where price will bring us next.
Happy Trading,
Colibri Trader
p.s.
A very relevant educational article here is the Bull/Bear Trap. I highly recommend you to read it if you have not already.


World-class content!!! Thanks!!!
Thanks for the nice words!