Dow Jones Trading Analysis 18.12.2024 [Warning Signs Point to a Potential Correction]
Dear traders,
Last time I wrote about Gold and since then I have had one of the best trading periods.
Today, I am expecting the FED decision and not really trading.
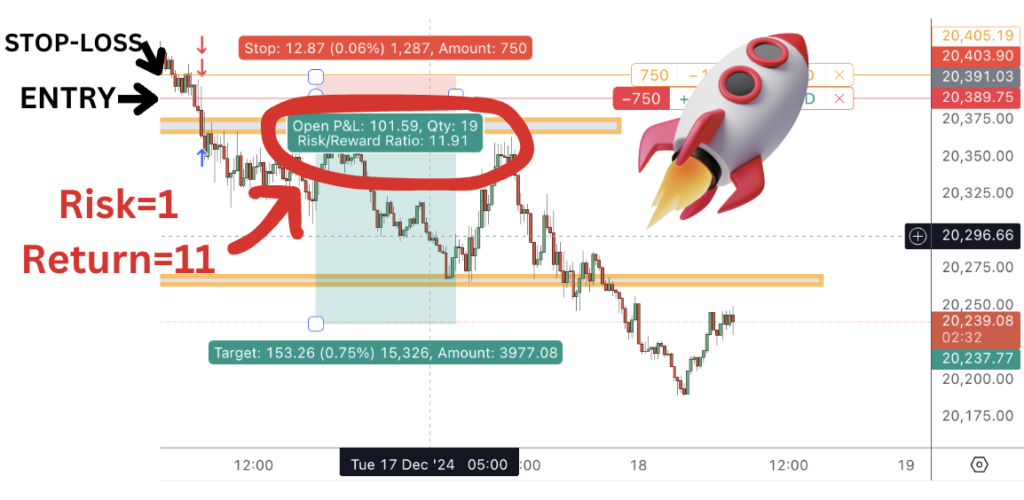
But I am carrying a trade from Monday, which is currently giving me 11Rs or 1:11 risk-to-reward ratio

This trade was taken in my day trading room on Monday.
I will very likely hold onto this trade during the FOMC unless the landscape changes.
So, let’s see…
Dow Jones Trading Analysis 18.12.2024
Today, I am looking at Dow Jones and have noticed a few worrying signs.
I believe we might be at a tipping point.
- We’ve had the longest bull market in history
- Historically, under republican presidents, you have higher chances (roughly 20% higher) to experience a downturn
- The technicals are telling me a correction might be due
The Longest Bull Cycle
Longest Bull Run (2009–2020):
After the financial crisis bottomed in March 2009, the U.S. stock market (as measured by the S&P 500) began a historic bull run characterized by steady growth with only brief pullbacks. This expansion lasted approximately 11 years—a record duration—until the rapid, pandemic-related decline in early 2020 brought it to a close.
Subsequent Market Cycles:
Following the sharp 2020 drop, markets staged a strong rally into 2021. However, various factors—ranging from inflationary pressures, shifts in Federal Reserve policy, global conflicts, and supply chain disruptions—led to another mini-bear market phase in 2022. This indicates that the market has not seen another uninterrupted, record-length bull cycle since 2009–2020.
Republican vs. Democrat
Under Republican Presidents:
Major bear markets started or occurred under Hoover (1929), Eisenhower (1956-57), Nixon/Ford (1973-74), Reagan (1987 crash), G.W. Bush (2007-09 crisis), Trump (2020 COVID crash).
This gives us roughly 6 notable bear market periods initiated under or closely associated with Republican leadership.
Under Democratic Presidents:
Major bear markets started or occurred under FDR (1937-38), Truman (1946-49), Kennedy (1961-62). The rest often started under one party and ended under another. Clinton’s tenure saw a strong bull market that ended right as he left office (dot-com bust began near the transition), and Obama inherited the 2007-09 crisis rather than starting it.
Clearly initiated bear periods under Democrats could be considered around 3–4 if counting ones that started on their watch (e.g., FDR 1937-38, Truman 1946-49, Kennedy 1961-62).
The Technicals
And finally, what are the technicals telling us?
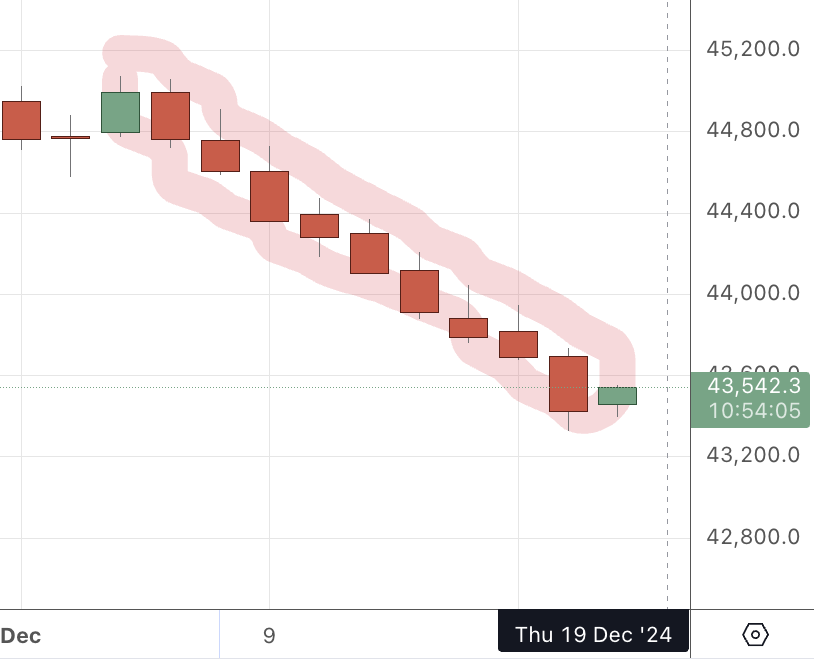
It looks like we’ve had 9 sessions of interrupted selling.

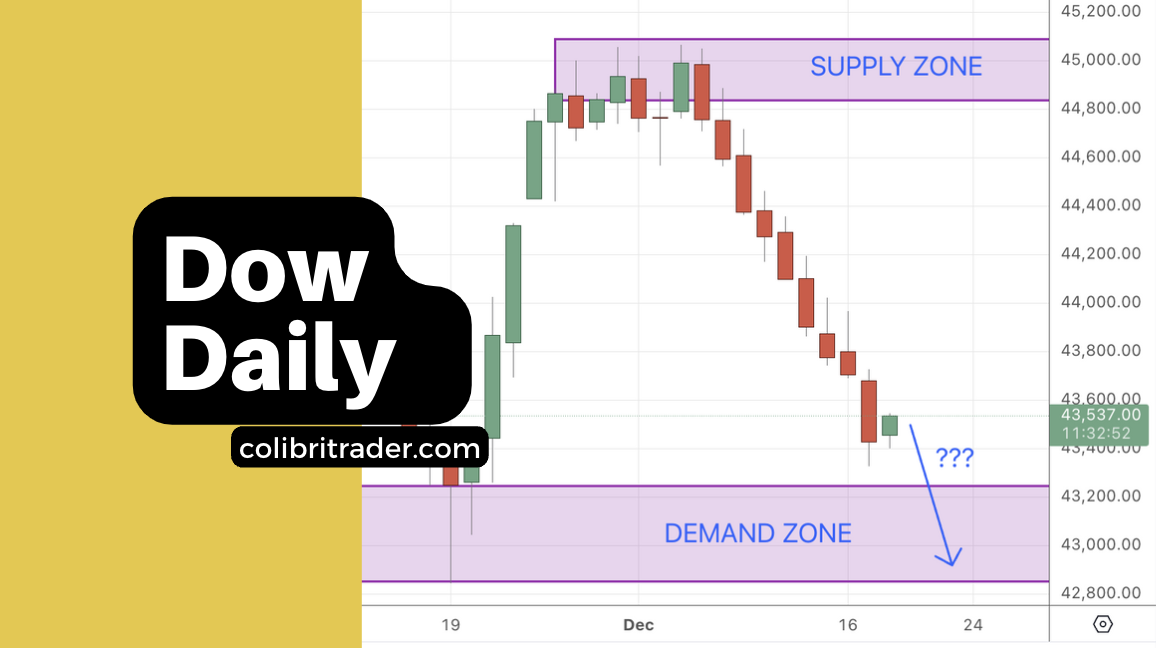
This is the daily chart of Dow Jones and if today finishes a red day, this would be the tenth day of consecutive losses for Dow Jones.
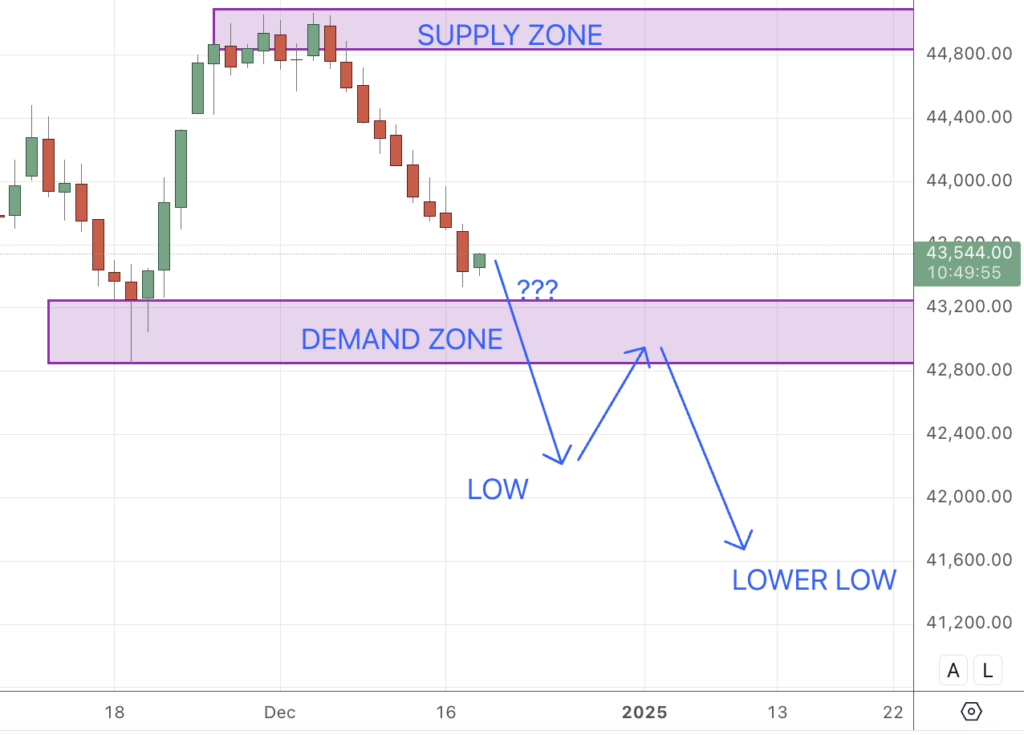
Also, it looks like the price has formed a supply zone at a round psychological number at 45,000 which is considered by many as a good profit-taking area.
Since we are at all-time highs, it is harder to read the market, but if we see a break below the demand zone from the image above, this for me would be a worrying sign.
If we see the following scenario playing out, this for me would be an almost sure sign of a market-turning point:

Therefore, I will wait for a confirmation from a breakout of this demand zone and then I will look for a second lower low.
If I see that, then I will be worried and most likely act on it 🙂

If you want to be the first to know when I act, you can join my DAY TRADING ROOM, where I share my trades in real-time. That’s where I took the 11R trade from above.
See you on the other side 🙂
Happy trading,
Atanas


