DAX (Germany 30) Trading Analysis
DAX (Germany 30) Trading Analysis
Dear traders,
The trading analysis from last time was on USDJPY. I was expecting to see price reaching down to the 105.50 handle.
Price has been reached this level and I managed to squeeze a small profitable trade. Currently, price is rebounding from this level and I have closed my short trade.
There is a small inside day candlestick formation on the daily timeframe.
I am not as certain as before that price will continue its downfall and therefore prefer to not stay in this trade.
In fact, this pair looks to me more bullish than bearish. I won’t be surprised to see the price going up to 108.00 again. Having said that, I do not intend to trade this pair at this moment of time.
DAX (Germany 30) Trading Analysis
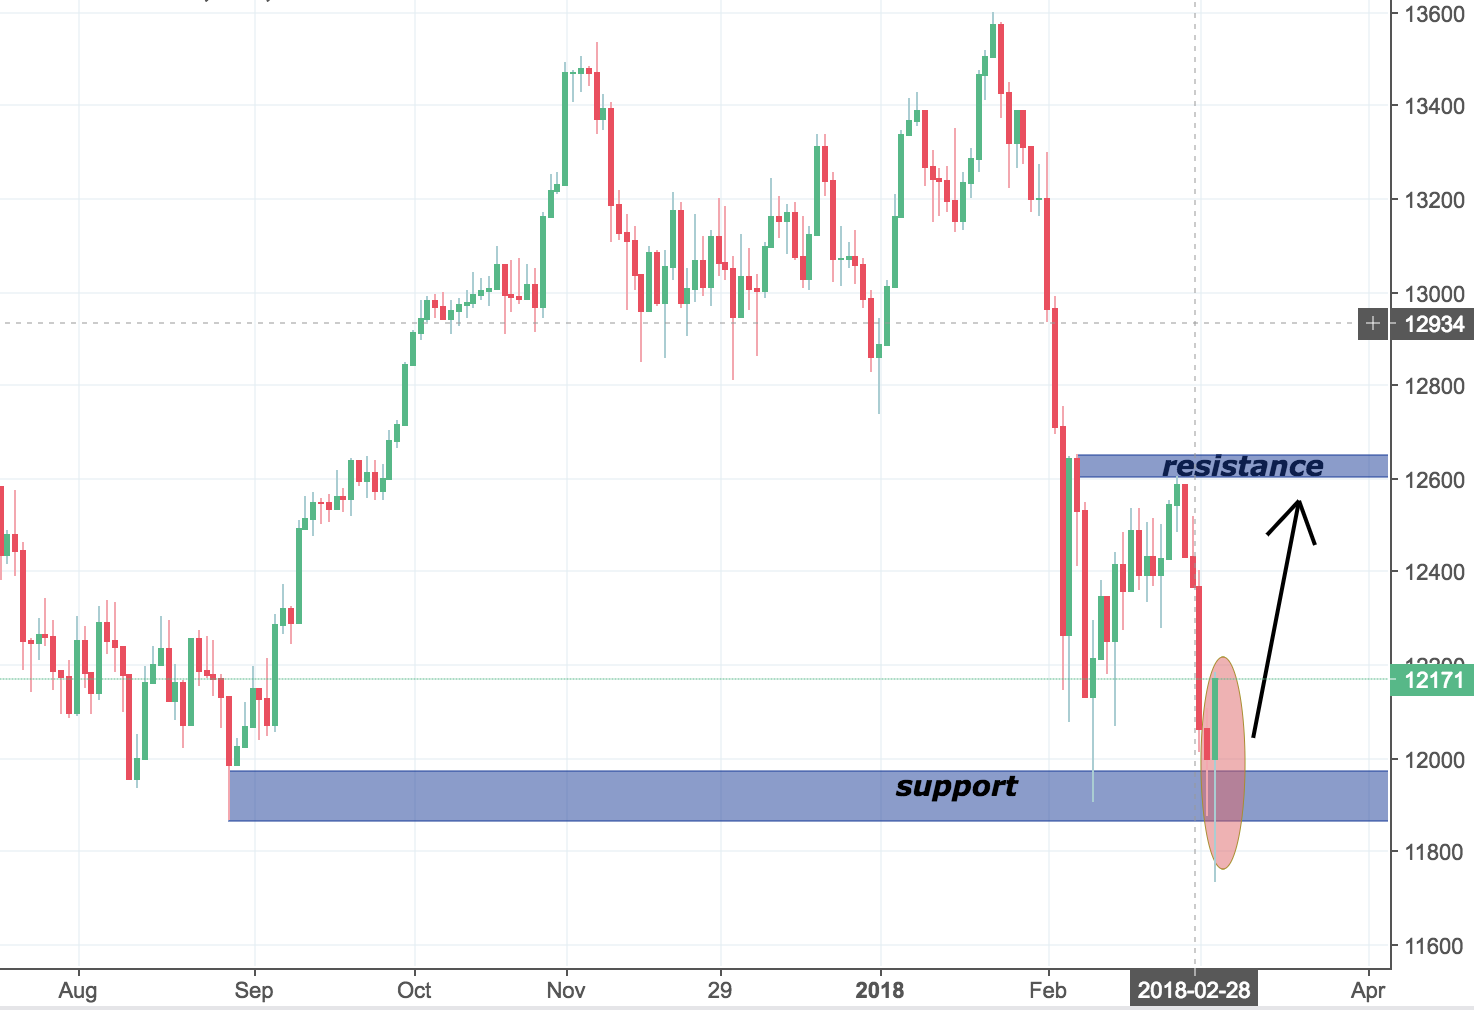
I am looking at the german index- DAX. It has printed a big bearish rejection candle on the daily timeframe.
The 4H timeframe looks as bullish as the daily one. I even wrote about it on Twitter today. You can check it out HERE
There is a major support level just below 12,000. It looks like this level is holding strong for now.
I will be following price action and see if there won’t be a price action pattern that rejects the bullish momentum.
For the time being, it looks more bullish than bearish. The next imminent resistance level is at 12,650.
Happy Trading,
Colibri Trader
p.s.
Check out my recent article on MACD HERE


Good tradeidea. Waiting too for retracement to 12650. But take care of the downtrend in H4. Dax should break this barrier to reach 12650 and later maybe 61.80er Fibo.
So far it has been ranging between 12000 and 12300. Let’s see 🙂
Not easy to trade in time of heavy political decisions, but your target is still reachable. Just want inform, tomorrow in germany is the “day of stocks” (people can trade stocks for free at this day). Before it’s typical the inex rise. But be careful, probably it will fall on monday.
Hi Chris,
Thanks for your comments! Keep them coming. Just to let you know that I trade strictly price action and as such don’t pay a lot of attention to fundamentals.
Hello Colibritrader
Dax Daily
What do you make of the 3 pin bars at swing lows and pos divergence on RSI
Something to monitor closely for a potential long you reckon.
This one is a tricky one. I am looking at a potential rejection of the 12,000 level and a possible short. But nothing for now. I would not be looking to go long for the time being 🙂
Actually more looking into my EURUSD trade for now
Hi Colibritrader,
I see the 12k level of R too do you ever consider the round # theory for R at all ?
I also see if 12K is breached then 12250 the next R level.
Did you manage to enter any shorts from the 13500 level d/ward ?
I do believe in that theory- for the round numbers. Although, I need to see price action confirming or rejecting such numbers 🙂
Hi Colibri,
Daily DAX showing Pos Divergence for RSI
This is based on the close for those sessions not the intraday spikes
Bulls are at work behind the scenes it seems
Just an observation shared at this point
Regards
We are seeing DAX higher and higher. Currently looking at the 12600 level as a potential target (reversal or continuation area).
Hello Colibri,
As you’ve said, “time knows better”. As a trader we always have to be on the lookout for probabilities.
Higher probability the better (R:R)
How would you answer this ? Have we put in yet another lower high last session. What tools do you know of that could help confirm.
Certainly would be a good R:R on a short
BTW mind the gap
Regards
http://fxpro.ctrader.com/c/2Tp6n
PS the link shows a CFD chart. It’s for illustration purpose.
🙂 I got that 🙂
Again- we need to see price reaching above 12600 before we can be certain. Before that, we can just read the market and try not to “expect” but follow what it gives us 🙂
Hi Colibri,
Thanks for your replies, actually what I was pertaining to was on the short side.
I meant what tools do you use to confirm that the latest lower high can deliver a short trade coming.
EG: Does the intraday sessions give you clues ?
“Have we put in yet another lower high last session. What tools do you know of that could help confirm.
Certainly would be a good R:R on a short”
Hello Colibri,
Some commentary below
I noticed price action is hanging around the red resistance line.
Has not fallen away like the previous attempts
http://fxpro.ctrader.com/c/m9p6n
Looks similar to chart #2
Chart # 2
http://fxpro.ctrader.com/c/C9p6n
Remains to be seen but 13250 target, anythings possible
PS These charts are MT4
Hi Dan,
I am not really using channels in my trading. As one of the students that have taken my course, you should know better what tools I am using on a daily basis. I find them more subjective than support and resistance levels. But again- I am looking at the 12600 area for rejection or a breakout
Hello Colibri,
Thanks for your reply, I will sincerely consider your points.
Hi Colibri,
Interesting price action at said level.
Almost to the tick for 50%fib
http://fxpro.ctrader.com/c/qJx6n
Funny thing is that I just saw your comment regarding DAX. There are two bearish rejections on the daily so far. It looks more bullish than bearish, but either way don’t think I am looking at DAX for the time being.