DAX (Germany 30) Post-Trading Analysis
DAX (Germany 30) Post-Trading Analysis
@Colibritrader
Dear traders,
I usually don’t do that, but now I am tempted. Post-trading analysis is not as exciting as trading analysis, but it could be twice as educative as the latter.
A few weeks ago I wrote about DAX and an imminent Demand zone.
I was looking to short until the price went below this level and then go long.
As the majority of you probably know from my Supply and Demand course, I am looking for a specific setup under the demand zone to go long.
In this case I had a great setup and managed to minimise my risk, while going long.
Then, I had a few other opportunities to go long along the way. As you can see, this zone was extremely strong and the price bounced up almost 1,000 points!
1,000 points!
If that’s not a great way to trade with supply and demand zones, I don’t know what is.
DAX (Germany 30) Post-Trading Analysis in details from the Daily
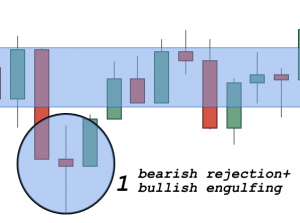
If we look at price action and dissect it, we will see that there were a few places where you could have gone long if you missed the initial place, which is shown below:
Price was just below the demand zone (perfect location according to my supply and demand trading strategy) and then formed 1) bearish rejection candle and 2) bullish engulfing candle
The next place where you could have entered into a trade appeared a few trading days later. Here is a screenshot of that opportunity:
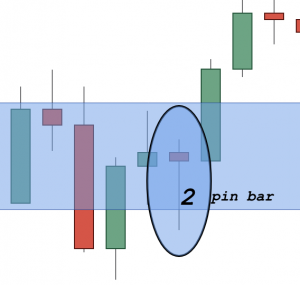
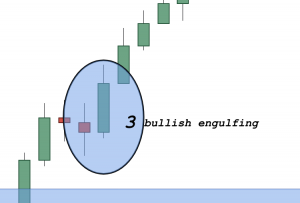
After this candle, there was another opportunity to go long directly from the daily chart. It occurred a few trading sessions later. Here it is:
Slightly higher than the demand zone, this bullish engulfing candle was the last signal from the daily chart that you could have taken.
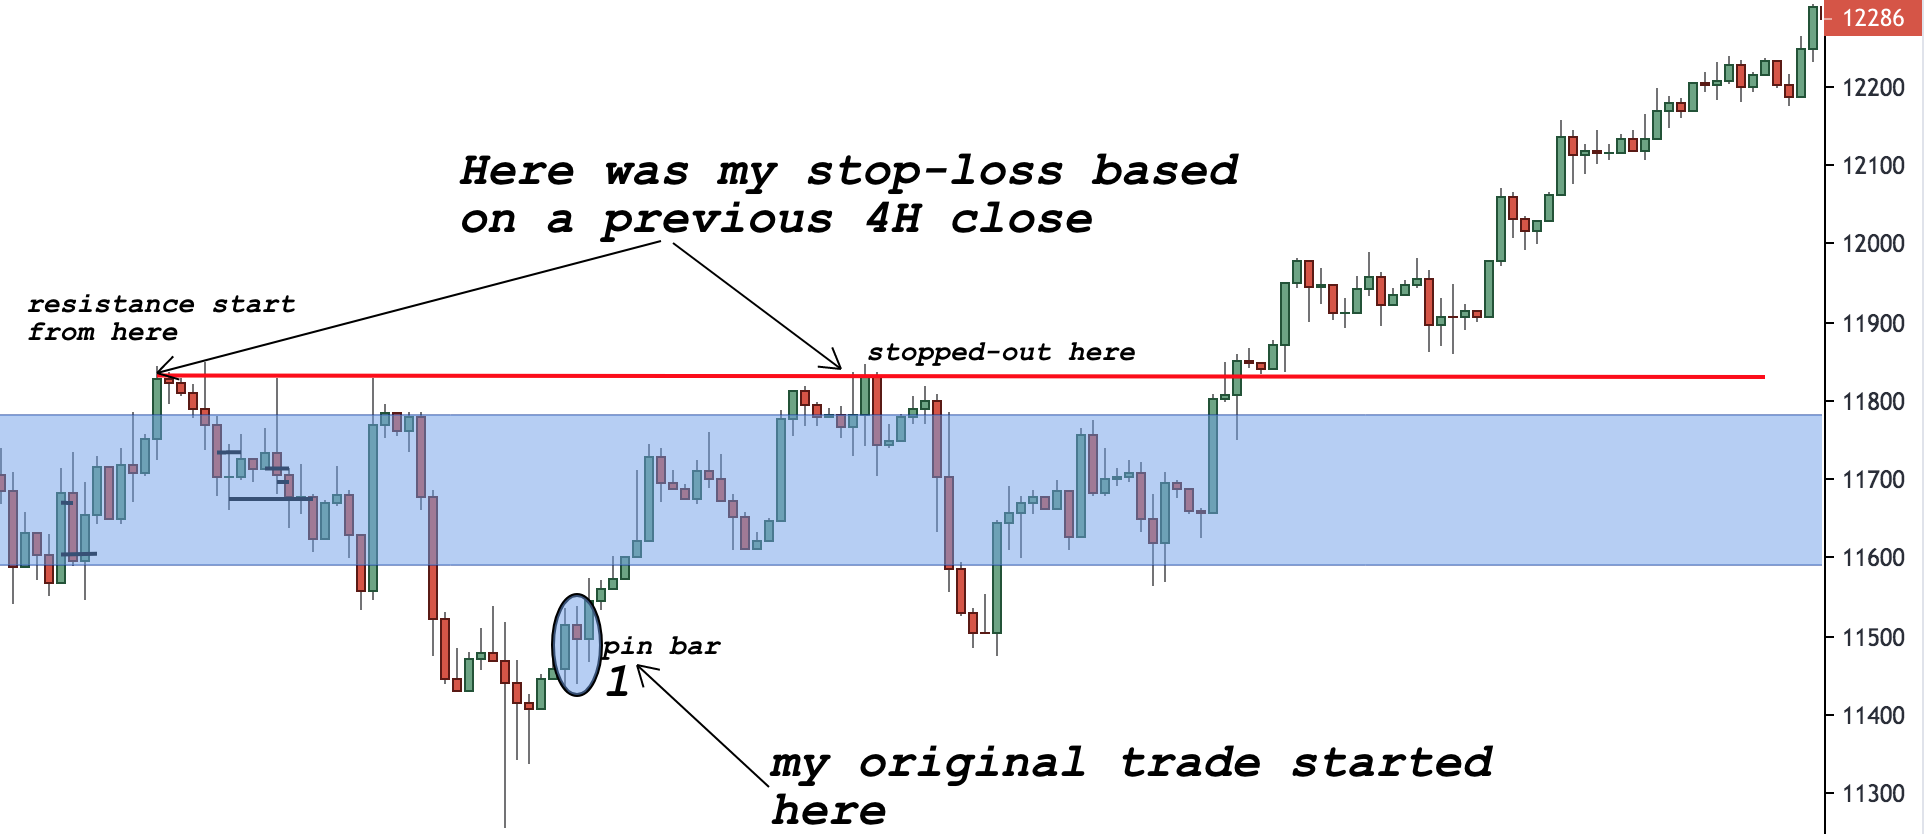
In my real trading I missed the last two, but I was long from under the demand zone. Unfortunately, I am not still long and I could not make the most of this move, but I still had a very good return on my initial trade.
The reason being was that I was on a holiday and while away, I like to take my mind away from the markets even though I am still checking the charts once in a while.
DAX (Germany 30) 4 hour chart
On the 4H chart, there were a lot more opportunities to go long. As the ones amongst you who have taken my price action course know, that’s where the real risk minimising happens.
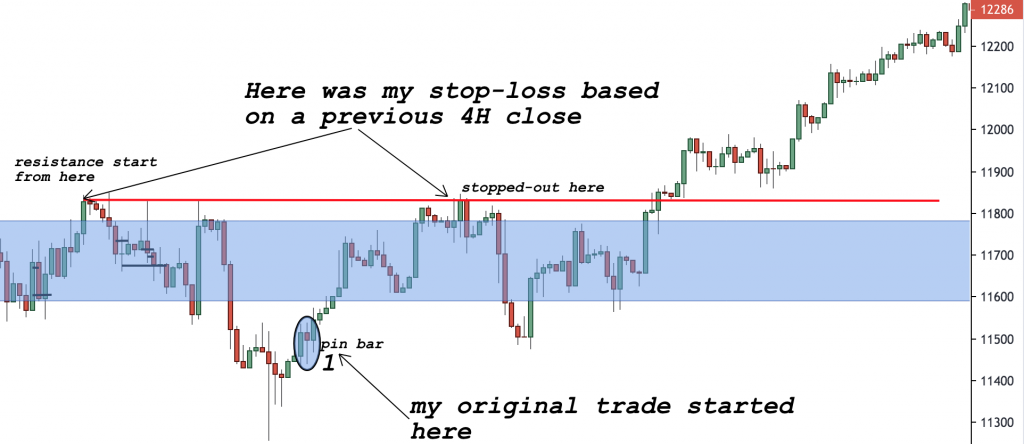
Here is where I took a trade and where I was stopped-out:
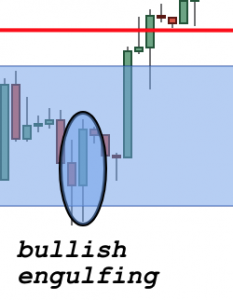
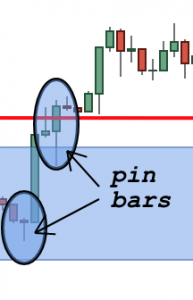
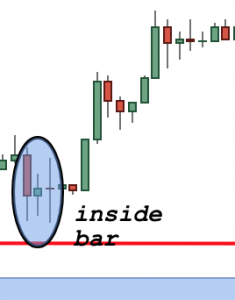
Along the way you had a lot of other opportunities to go long based on the 4H chart, like this one:
or this one:
or that one:
As you can see there were plenty of opportunities and I have shared with you just a few of them to get the gist.
All in all, this could have been the best opportunity in the second half of this year alongside the gold market, which I discussed earlier last month.
Happy Sunday,
Colibri Trader
p.s.
Check out my article on Advanced Supply and Demand trading if you are interested to learn more


Nice. I managed to trade dax too. Now dax is at a major high. We could have a short trade set up this week.
Hi Ade, I will wait for the price to climb above the imminent supply zone. Let’s see how price action will play out- for me it is still early to say 🙂