Crude Oil Trading Setup
Crude Oil Trading Setup
by: Colibri Trader
Dear Traders,
The trading ideas from the last few times have been performing wonderfully. The US Indices seem to be in a small correction as expected. Let’s see how long will that correction continue.
The EURJPY trading setup did gain quite a few pips and now seems to be bouncing off from the first target. GBPJPY has returned even more pips, but it is bouncing off from minor support, too.
Crude Oil Trading Setup
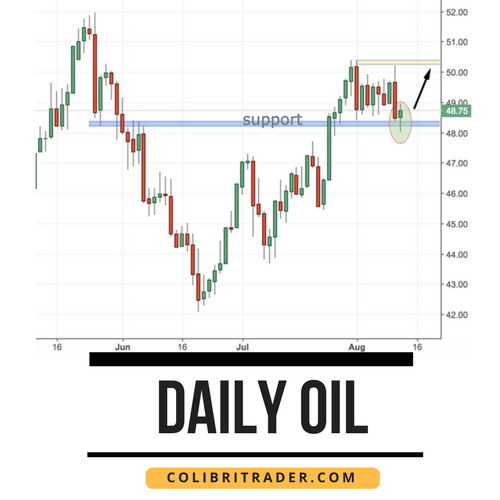
Today, I am looking at another possible trading setup. It seems like Crude Oil is getting ready for a small resumption of the uptrend. Friday’s candle is a bearish rejection.
It looks like a pinbar, which formed on a minor support level. I am expecting to see a possible small retracement towards 48.50. Depending on the open, I will decide if a long trade is on the table.
I will also check with the intraday action from the 4H chart, because so far there is a small bullish rejection on the 4H chart. This is not a very affirmative sign, that’s why I will be looking more in-depth for a bearish rejection on the 4H.
My hypothetical target will be the zone between 50.00-50.50.
Happy Trading,
Colibri Trader
p.s.
Have you checked out my latest article on how to Check for the Best Trade Every Day
Or the power of Symmetrical Triangles
For anything else, you should know my e-mail by now: admin@colibritrader.com


Hi Colibri,
Crude seems to be in a downtrend at present, lower highs and lows. (Daily)
A break above 49.00 might be on it’s way to negating this market structure but immediate R is at 50.70 so essentially taking a long near R is not ideal.
I fully understand your not taking trades only alerting us as to possibilities.
So thank you for that, once again my take on current printed bars.
The daily cluster that has just formed contains 2 very big bear bars, I wonder what’s up with that ?
Longs selling or sellers buying more shorts, maybe a combo.
Weekly is in a sort of trading range. Ultimate support at 43.70
Some running commentary from me.
Cheers
Hi Dan,
Crude is in a range at the moment- if we are talking about the Daily TF. It seems to be closer to the lower boundary than the higher one. There was a daily price action setup that I liked and I am currently monitoring lower TF. I agree, it is not a major support level and that is why I am sharing in my article, that I “might” be looking for a trade and a short-lived one obviously :). But, if we see a break lower, your words might come true 🙂
Thanks for the great comments- keep them coming 🙂
Hi Colibri,
Can we revisit crude again , there is a bullish RSi divergence on the 4 hour chart and hammer occurred on 30th Aug , one trigger signal was generated on 31st Aug . Can this now move towards your hypothetical target of 50 ? Let me know how you see this counter .
Cheers .
Hi Anil,
What is more important is to have a major support/resistance area and a daily candlestick formation. Everything else is secondary. Hope that helps
This turned out pretty well!
Colibri
How do we qualify a support / resistance level as a major . I have always been confused about this .
Cheers.
You can check out my support and resistance article:
https://www.colibritrader.com/the-most-comprehensive-article-on-support-and-resistance-online/
Let me know if it is still unclear
Hello Colibri,
Have your eyes caught the pattern in crude ?
DT Neg Div RSI on Daily @ 66.22 area
Doji on Mar 26th, followed by bear engulf
Seems a poss trend reversal taking place, the only thing is that a short trade now is trading against the trend, this could be a big no no but quite the strong set of signals atm.
UPDATE:
This setup and aligned factors were too numerous to miss.
I could only enter and place my stop and let it run.
Currently short @ 65.62 with a stop @ 67.01
Risking 500.00 max loss
TP 61.82
I am not yet seeing a negative divergence. There must be a second peak that is higher than the first one! Possibly soon
Hi,
You are correct, near enough is not the same .
Thanks for your patience and reply.
Just reviewing your course atm.
Regards
Colibri,
So by default there will always be neg divergence on the second higher peak for a security, as RSI is a momentum indicator that compares speed of movement in the later price moves.
In immediate peaks there is usually this neg divergence but in peaks made at a much later date there seems to not be this neg divergence.
Just curious on your thoughts of it’s relaibility.
Thank you
Reading this atm
https://www.colibritrader.com/rsi-indicator-explained/
Go for it 🙂
Hi,
Then we did have NEG divergence with RSI on the DAX with the last high around 13593
Did you consider that an alert back then ?
Regards
Dan
Yes, I even wrote about it on my website and Twitter 🙂 It was a very good trade indeed:
https://www.colibritrader.com/dax-germany-30-trading-analysis-2/
Hi Dan,
That is why I am not using RSI on its own. I use mainly price action as you have seen from my trading course. Also, I use the higher timeframes
Enjoy and let me know if you have any questions regarding my trading course
Hi Colibri,
The short pos in crude has moved lower, it remains to be seen if it’s a bonafide trend change or not
Correct… let’s wait and see. Currently no positions in it, though