American Indices Technical Analysis and Why Now Can Be a Great Trading Opportunity
American Indices Technical Analysis and Why Now Can Be a Great Trading Opportunity
Dear traders,
In my last technical analysis I shared with you my view on crude oil.
Crude certainly is at a flexion point. There is a bearish engulfing pattern that has encapsulated the previous candle’s body.
There is also a major resistance level at 75.00.
On the weekly timeframe price action is printing a bullish rejection candle.
All of those factors lead me to think that the stance is really changing from bullish to bearish.
If technical analysis is confirmed by fundamental analysis, then this might be a top in the forming.
American Indices Technical Analysis
After doing my usual Sunday charts analysis, I have found a couple of coincidences, which made me think that US indices might be ripe for a sell-off.
Important: I am not trying to catch a falling knife- or in other words, I am not trying to call a top!
Pure price action is just telling me that there might be a correction due and if that happens, there might be even a major sell-off.
As you probably already know, I am trying to stay away from extreme statements.
Traders should be testing the formation of a new price action pattern first and then have a trading system that helps them to stay in that trend for as long as possible.
That is exactly what I am trying to do and what I am following at the moment.
Why technical analysis tells me that American indices are bound to go lower
There are a few technical indicators that appear to be turning bearish. Let’s analyse Dow Jones and Nasdaq separately.
Dow Jones
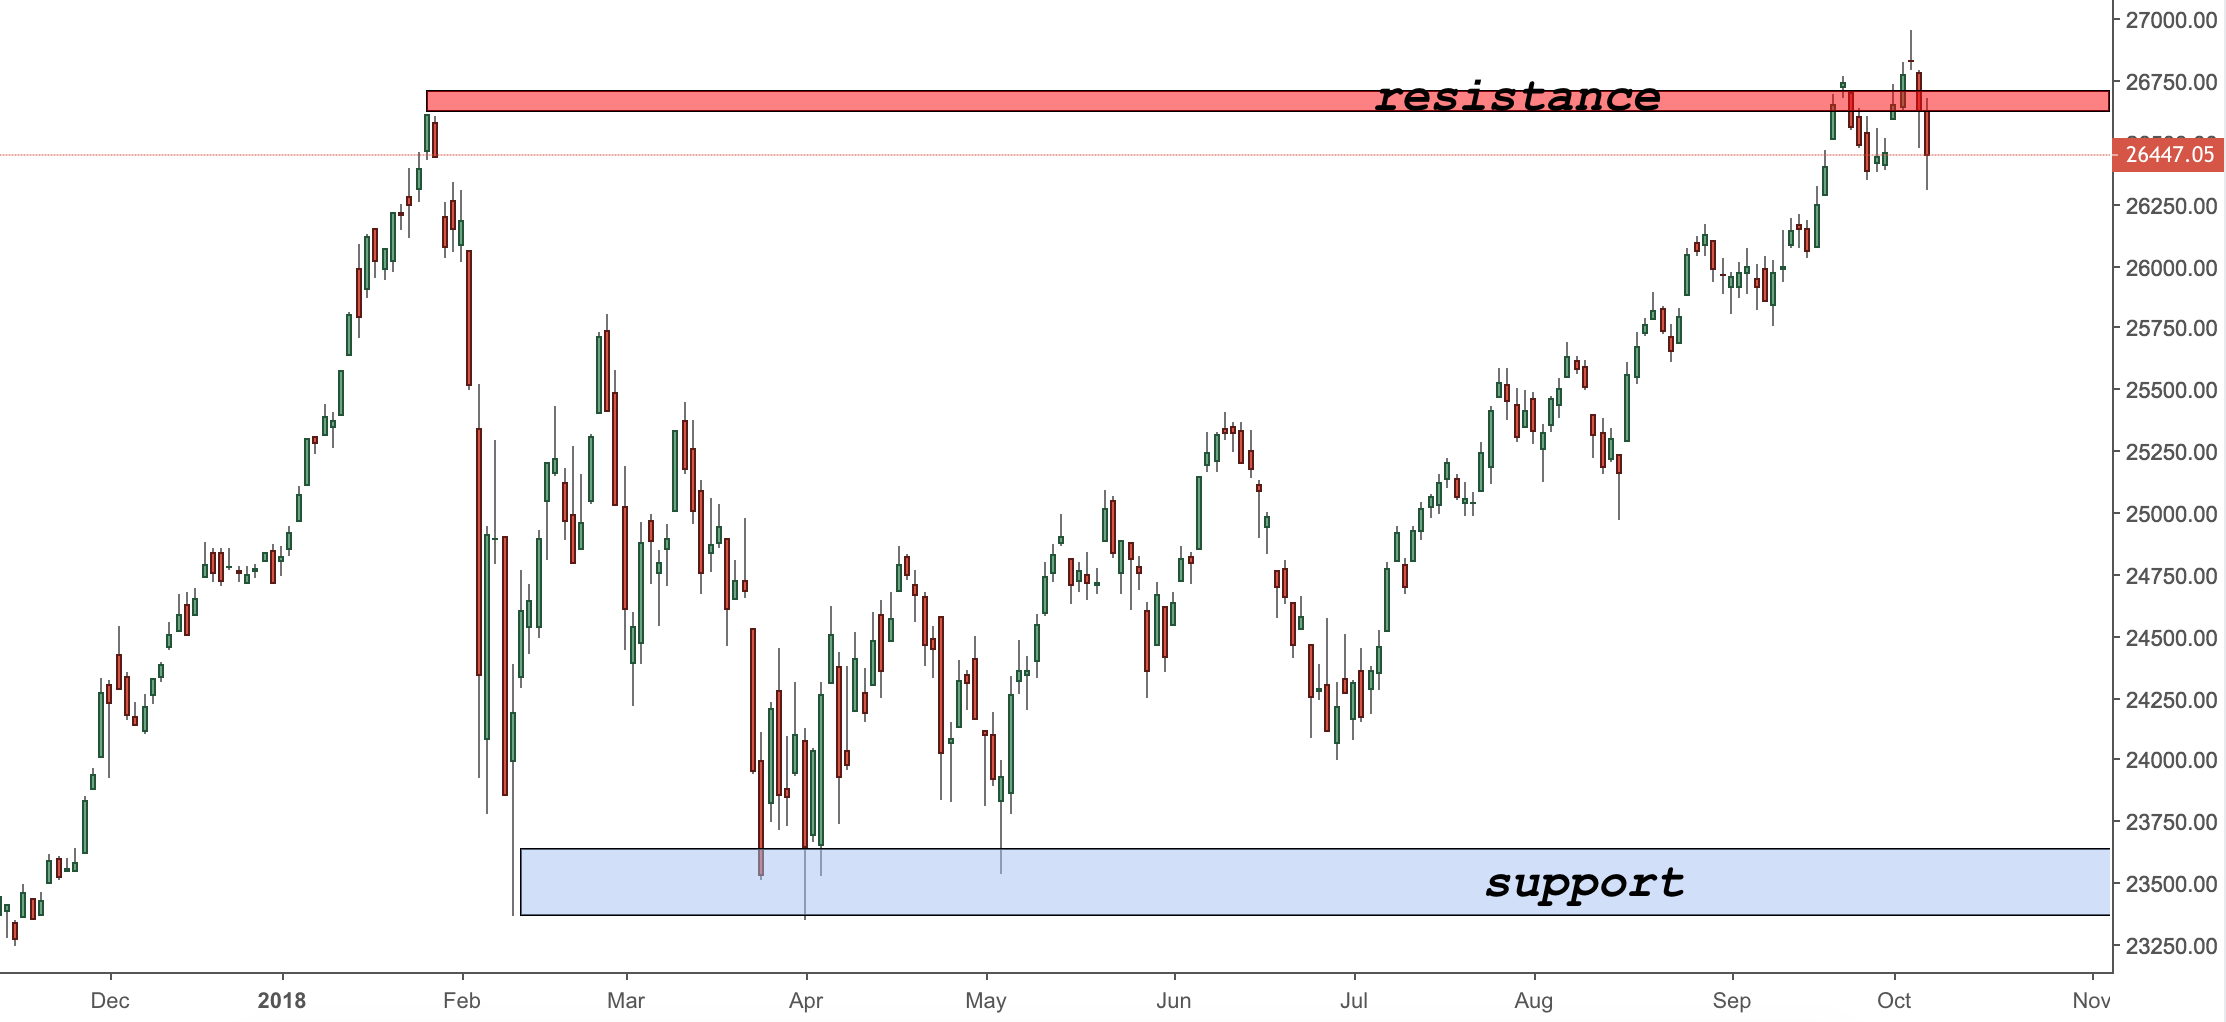
First of all, there is a major resistance area which price is testing at the moment.
Second of all, there is a very clear candlestick formation, which bodes well for the bears.
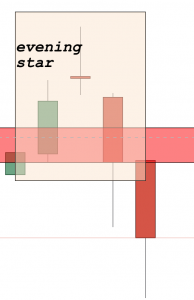
Here is an evening star, which is certainly a reversal pattern.
The screenshot above is a magnified version of the place where this pattern formed.
Those two technical analysis factors are telling me that the american index is about to see at least a minor correction.
Let’s have a look at Nasdaq now.
Nasdaq
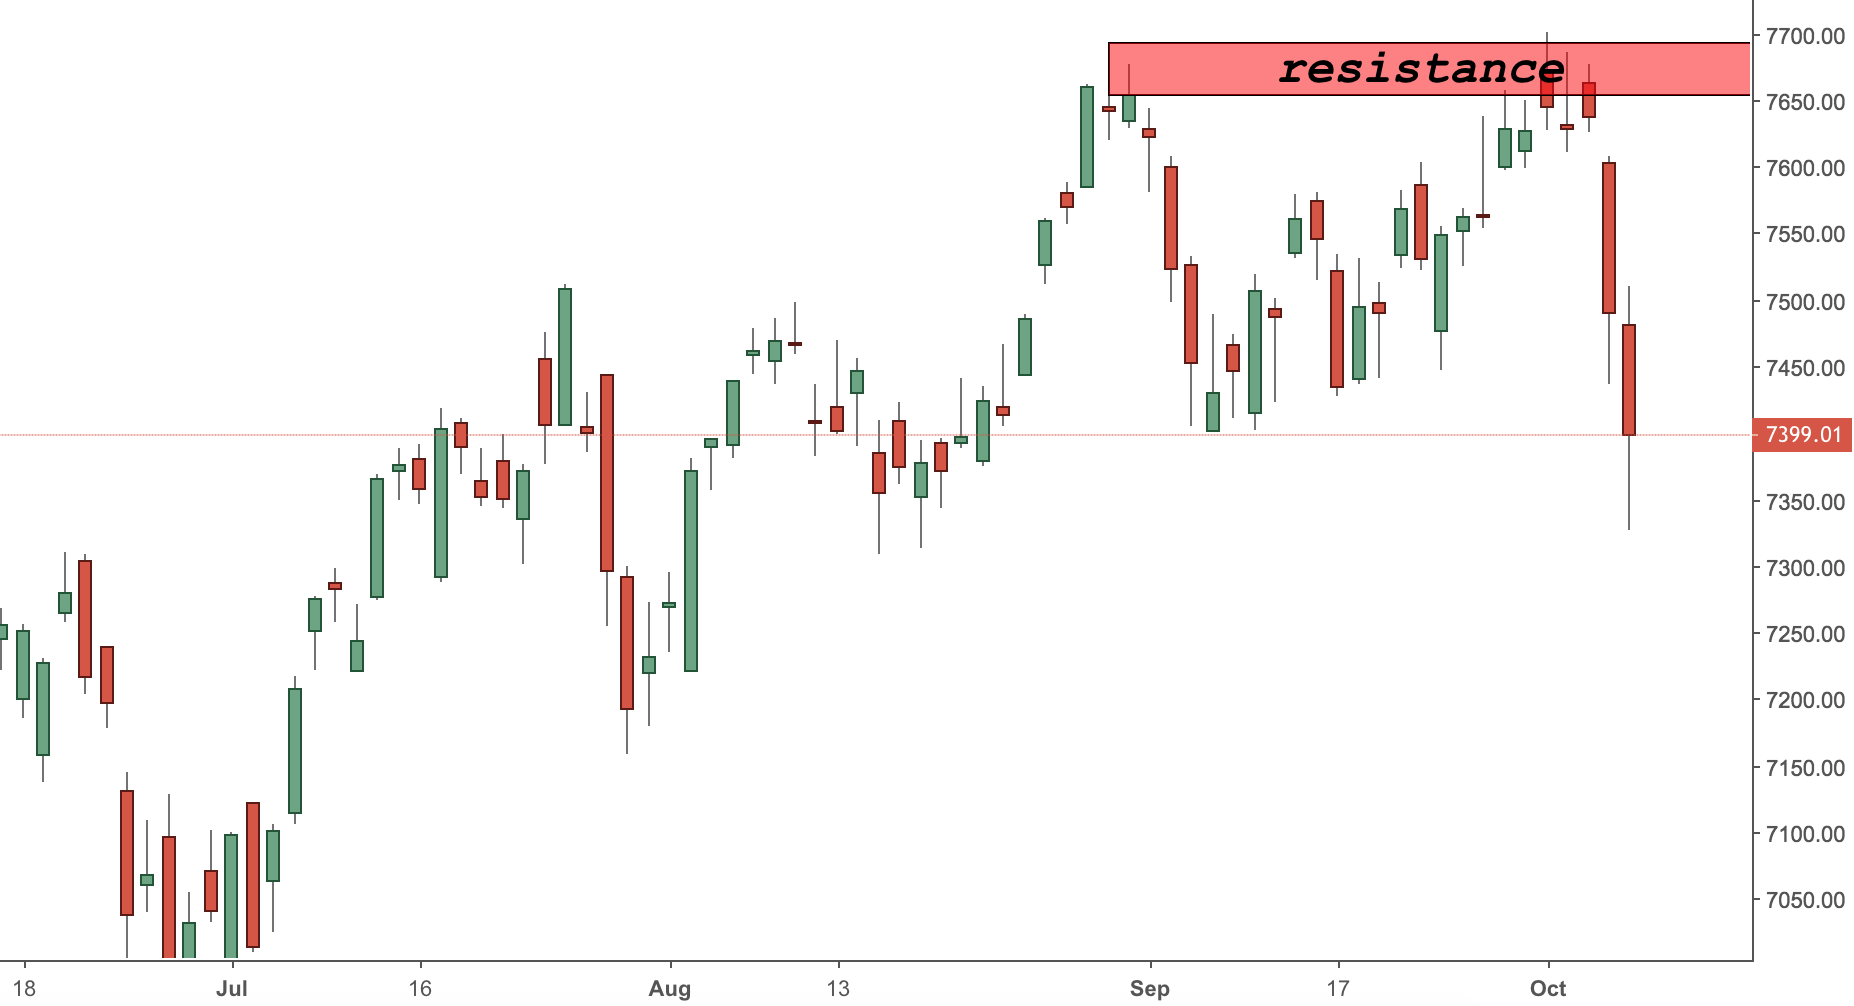
At a first sight, it seems like Nasdaq is experiencing a very similar situation.
There is a resistance level at 7700 that has been tested and price failed.
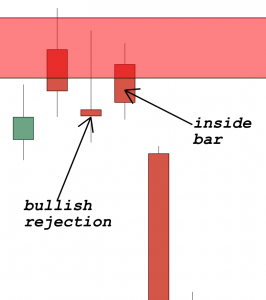
Price action has also rejected that level by printing a bullish rejection candle and then an inside bar.
The combination of those factors are both bearish and certainly confirming the first scenario of Dow Jones.
As we know, US indices move in tandem, so those two signals are stronger together than if only one of the indices exhibited bearish behaviour.
Germany 30 (DAX)
A third and final confirmation might be coming from DAX
As has been historically tested and proven:
The German stock market has preceded the US stock market before major turning points.
If DAX has already printed a top, then what is next?
Exactly… American indices are to follow.
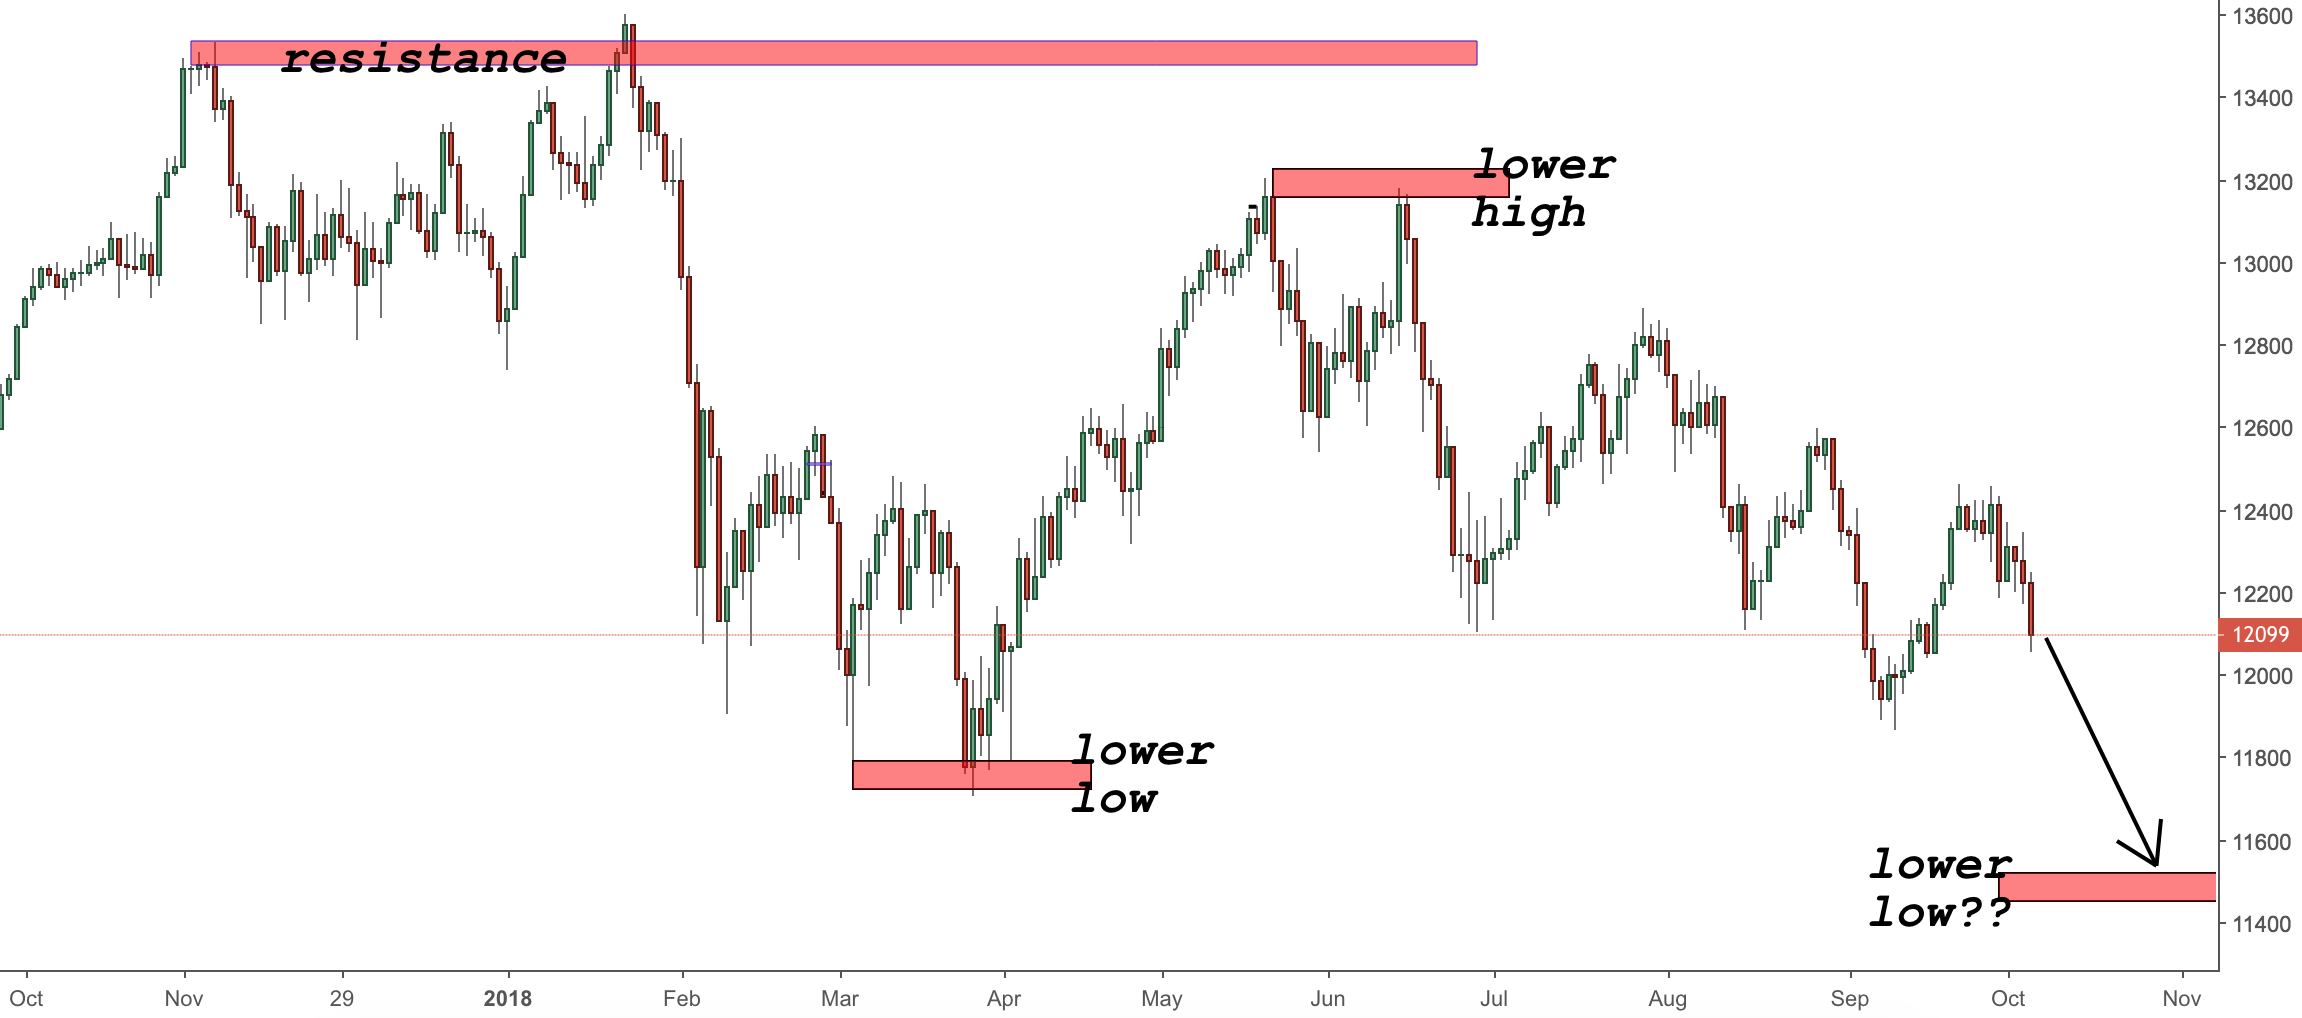
Check out a screenshot of DAX below:
As can be seen from the chart above, we had a major resistance in the beginning of 2018, which was not broken.
Since then price has been falling to form a new lower low and a new lower high.
So, is price ready to make a new lower low?
As far as I am concerned and considering the information given above, this is a very likely scenario.
Where next?
From the analysis above one can see that american indices might be about to make a minor/major correction.
No matter what the next move is, price action can guide you to take the right trading decision.
Always read what the market tells you and NEVER HAVE EXPECTATIONS.
Expectations DO NOT WORK!
Happy Sunday,
Colibri Trader
p.s.
Check out my recent article on Range Trading vs. Trend Following


